Kerch ReportContribution Agreement No 07.0203/2008/518960/SUB/D2 "Environmental Monitoring for the Black Sea Basin: Monitoring and Information Systems for Reducing Oil Pollution" |
|
This book has been written in memory of those whose lives have been lost to the sea.
Seafarers, fishermen and marine researchers know the restless sea waves and the storm gales, the heavy rain and soaking wet humidity, the extreme heat and cold, the fearful collisions, the fires, or the hard to break ice-sheets, when there is nothing romantic about being away from land. In various manuals you can find simple instructions for this most difficult of all environments to survive (the desert, the harsh polar regions and the tropics (among the snakes and deadly diseases) are considered easier). Your ability to stay alive in a marine environment depends upon:
Undoubtedly, and especially during an accident at sea, all this knowledge, skill and will, listed above, is crucial in the matter of life and death. However, there are better ways to survive in this unsteady world and these lie in precaution and preventative measures. As is well known, the Kerch accident happened because of a heavy storm, lives were lost and gallons of oil leaked into the sea causing a catastrophic environmental disaster. Of course, storms at sea may be extremely destructive and we cannot prevent them. However, these storms are predictable. All you can do when they are forecast to strike is listen to the early warnings and remove yourself from harm’s way. The Kerch storm was forecast well in advance. Therefore, why did the Kerch accident happen, what prevented the people from acting more quickly in looking for a shelter and safe harbour? What did we learn from the Kerch accident? What should we do to avoid other accidents and to prepare well for emergency situations? We have written this book to answer these and similar questions and to communicate our findings to a wider audience.
Whilst drafting this book, we have received many different comments, some of them useful, others less. We have accepted all those comments that were from people who know the sea personally i.e. those whom have worked at sea, whom have risked their lives under difficult conditions and who have known critical situations from their own experience. Being ‘out of the sea’ and away from danger, comfortably sat in your arm-chair, it is easy to criticize how the ‘political sensitivities’ of the Kerch accident were handled. This involved talking openly about gaps in legislation and policy, use of old or inappropriate ships, non-qualified staff, commercial interests and illegal ship transportation, lack of capacity to save wild life or to utilise waste products, quality of clean-up operations at sea and on coast, the chronic pollution in the Kerch Strait, and many other important issues. For those who have never worked at sea – we know that it is impossible to picture the despair and fear in an accident or in an emergency if you have never been in at least one storm away from land or maritime incident. However, imagine that your child works at sea – what would you do to spare him or her from an accident, have you even ever thought of this possibility? With this book we have aimed to increase public awareness on issues related to governance of environment protection in the Black Sea region and to advocate for transparency, hence wider public participation and bottom-up control, especially during accidents. We have used the ‘political sensitivities’ to sharpen your attention and to engage as many people as possible to concentrate on issues which would help in practice to better manage the risks at sea, saving human lives and protecting the environment more efficiently through enhancing the safety aspects of shipping.
The book is based on ideas born in the Black Sea Commission[1] and is supported financially by the EC/BSC project MONINFO (http://www.blacksea-commission.org/_projects_MONINFO.asp). In fact, the Kerch accident triggered discussions in the European Parliament about the safety of the Black Sea bearing in mind the plans of the Black Sea states for a several-fold increase in oil transportation and export capacities, the activities (on-going and envisaged) in oil/gas extraction and the new energy projects[2] discussed. The European Parliamentarians mentioned in their Resolution from 13th of December 2007 (http://eur-lex.europa.eu/) the key role that Black Sea regional organisations, in particular the Organisation for Black Sea Economic Cooperation (BSEC), can play in ensuring better management of and cooperation in seafaring on the Black Sea. In 2009 the EC provided substantial financial assistance to the Black Sea region to enable the coastal states to better prevent and respond to operational, accidental and illegal oil pollution. This financial assistance is managed by the BSC, the regional focal point in environment protection, in the frames of the MONINFO project mentioned above. This project will ensure by the end of 2011 the development of modern regional monitoring and information systems for the Black Sea to control oil pollution and its potential sources, and to enhance the maritime safety in the Black Sea region. In line with the main goals of the MONINFO project, the Kerch accident was analysed (as an event which happened as a consequence of natural disaster and human mistakes), contributing to clarifying the level of regional preparedness to accidents and efficiency of response to oil spills in the Black Sea region.
We hope this book will be equally interesting to professionals and non-professionals. It is a mixture of scientific and administrative approaches to the retelling and analysis of the events around the Kerch catastrophe of 11th of November 2007.
The ultimate purpose was to learn from the accident, to not let it slip into history without drawing and conveying the lessons learnt in as wide a context as possible. For instance, during the past 50 years, more than 10 accidents on a scale much larger than the Kerch Strait disaster have occurred in the Black Sea and its straits. We are fairly sure that only a few people remember them and about their disastrous effects. The book you hold in your hands is the first one to remind the people in the Black Sea region that accidents still happen too often in the Pontus Euxinus , to tell the story of one of them in detail, and to reiterate the need to better understand the sea’s hospitality, to cherish it and use it without conflict and risking human life.
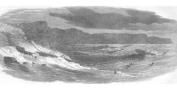
The Balaklava storm[3] and the numerous ships (from the Turkish-Anglo-French navy) in distress are shown in a single antique lithography from 1854 (reprint on the left). The Kerch storm and consequent disasters you can better visualize and understand through the numerous photos provided in this book. The authors of the book (you will find their names in the beginning of the different chapters) wrote it with great love and true devotion to the protection of the Black Sea and with the sincere wish to further contribute to the increased security in the region.
The editors and their colleagues spent many months in order to produce a well compiled text and high quality figures and photos. Although conducting an evaluation of a maritime accident can seem like a daunting task, we relished very much the process. The analyses of the Kerch catastrophe highlighted successes and failures; we believe the insight and clarity gained on the basis of this case-study will become incentives to further improvements of maritime safety in the Black Sea region.
This book reflects an enormous group effort. We are obliged to the interest and encouragement of many people who supported us from the very beginning and made this book possible. This most comprehensive compilation of materials available on the Kerch accident appeared thanks not so much to the financial assistance provided, as divided in between the numerous authors and contributors it became a minor incentive. The book was born because many people in the Black Sea region became excited about such a publication and worked hard to make it happen. It was a great pleasure for us to collaborate with such an enthusiastic team. We have been also fortunate to have significant feedback on the drafts from highly qualified specialists, which helped us to improve the book before its finalization. Officials from Russian Federation and Ukraine Ministries, experts from maritime administrations and other organizations working in the field of management of safety aspects of shipping or environment protection, in general, and more than 80 prominent scientists studying the Black Sea ecosystem have contributed to this book. Each chapter has been developed and then more than ten times redrafted with the participation of dozens of experts from different organizations. We would like to acknowledge the contribution of a number of individuals, who participated not only in the writing and revising of the book, but also to provision of materials, organization of cruises, which collected those materials, who commented constructively on the book or helped to illustrate it attractively.
We would like to acknowledge the support of the AzNIIRKH Director Dr. S.Agapov, who provided all the materials of the Institute collected in November 2007-2008 in the Kerch area, where 42 scientists worked hard to summarize the findings of the complex monitoring conducted after the Kerch accident in comparison with previous long-term investigations.
Thanks to Prof. Mikhail Flint (SIO RAS, Deputy Director), Acad. Valeriy Eremeev (IBSS Director), Acad. Vitaliy Ivanov (MHI Director), Mr. Viktor Borulko (UkrSCES Ex. Director), Prof. Evgeny Gubanov (YugNIRO Director) and their scientific and technical staff who organized a number of very important cruises in 2007-2009 to monitor the effect of the Kerch accident and greatly contributed to the post-disaster assessments. We are grateful to Dr. B. Trotsenko (YugNIRO, Kerch) and Dr. A. Boltachev (IBSS, Sevastopol) for sharing with us important reports and publications on the investigations in the Kerch area – prior and after the accident. Many thanks for the Directors of State Oceanographic Institute Mr. Vladymyr Komchatov (Moscow), Kuban Estuarine Hydrometeorological Station Mr. Alexey Ivanov (Temruk), Special Center on Hydrometeorology and Environmental Monitoring of the Black and Azov Seas Mr. Oleg Lusak (Sochi) and Marine Branch of Ukrainian Hydrometeorological Institute Dr. Yuriy Ilyin (Sevastopol) for providing a very valuable information and row data from the Hydrometorological Services of Russia and Ukraine on long-term routine monitoring data significant for current investigation. A large amount of knowledge after the accident in the Strait were provided by Mr. Ivan Samsonov and Mr. Akram Nasurov from “Chernomorsko-Azov Technical Direktsia on Technical Control on the Sea” of Rosprirodnadzor, and Ms. Natalia Kutaeva from Federal Agency of Sea and River Transport of Ministry of Transport of the Russian Federation. Many thank to all of you for your valuable support.
Great organization helps and valuable comments to the text content were provided by the stuff of the Black Sea Permanent Secretariat and MONINFO project experts: Prof. Ahmet Kideys, Mr. Dumitru Dorogan, Mr. Tayfun Sivas, Dr. Volodymyr Myroshnychenko and Mr. Kiril Iliev (all Istanbul). Many thank you for your time spending with this book and constructiveness at all stages of preparation during all three years.
Great thanks to Mr. Victor Chernov, he was the first officer from the Novorossiysk Maritime Administration, who provided a detailed information on the administrative measures taken before, during and immediately after the Kerch accident, including the SAR operations.
Captain Kjell Landin (OSPRI) helped us to find nice photos and to not forget about the important role of the IOPC Funds. Not to mention his and Peter Taylorl’s (OSPRI) constant support in the work of the Black Sea Commission in the field of safety aspects of shipping. Great Thanks dear friends!
Some of the results were received with additional financial support in the frame of special projects of Russian Foundation for Basic Research (RFBR projects 06-05-65177-а and 07-05-00565-а). Sub-satellite observations in the region of Tuzla Island were conducted during RFBR expedition project 08-05-10081-k. Satellite Envisat ASAR data were provided by the European Space Agency under projects АО Bear 2775 and C1P1027. Also, several studies of the consequences of the oil spill in the Kerch Strait were supported by the Fundamental Research Program 17 of the Presidium of the Russian Academy of Sciences, Fundamental Research Program 12 of the Branch of Earth Sciences of the Russian Academy of Sciences, the Ecological Policy Program of the Oil and Gas Sector, and the Russian Caucasus Regional Branch of the World Wildlife Foundation (WWF-Russia).
We would like to especially express our gratefulness to the translator of the book – Ms. Maria Beat. Ms. Beat not only translated or edited the book, but also professionally commented on many important issues and helped us tremendously to improve the quality of the texts.
The high quality of maps, figures and photos was provided by Dr. Vitaly Ermakov and Volodymyr Kochetkov. Much appreciation is extended to all of them.
We would like to express our deep gratitude to all those invisible solders at the front of the marine investigations - crew members of ships and technical staff of expeditions, to those who collect the samples and often fail to be mentioned among the authors of publications. Their quality work is the basis of the good marine science, the flour from which the scientists later bake the bread of the great insights in knowing Nature.
The opinions expressed are those of the authors supported by the editors. Any errors or omissions are responsibility of the editors and should be reported to them accordingly.
AMS – Aviation Meteorological Station
AzNIIRKH – Azov Scientific Institute for Fishery, Rostov-on-Don, Russia
BSC – Commission for the Protection of the Black Sea Against Pollution (Black Sea Commission, www.blacksea-commission.org)
BSC PS – Black Sea Commission Permanent Secretariat
BSIMAP - Black Sea Integrated Monitoring Program
ChAD - “Chernomorsko-Azov Technical Direktsia on Technical Control on the Sea” of Rosprirodnadzor, Novorossiysk, Russia
DL – Detection Limit
DSRUTO - Department for Safe and Rescue Measures, and Boat Lifting Underwater Technical Operations, Novorossiysk, Russia
ESAS AG – Environmental Safety Aspects of Shipping Advisory Group of the BSC
HMS – Hydrometeorological Station
IBSS – Institute of Biology of the Southern Seas of National Academy of Sciences of Ukraine (NASU), Sevastopol, Ukraine
IKI RAS - Space Research Institute of Russian Academy of Sciences, Moscow, Russia
EHMSK– Estuarine Hydrometeorological Station “Kuban” (former Kuban Estuarine Station) of the State Department “Krasnodar Center of Hydrometeorological Service” of Roshydromet, Temruk, Russia
MAC – Maximum Allowed Concentration of pollutants in water
MB UHMI – Marine Branch of Ukrainian Hydrometeorological Institute, Sevastopol, Ukraine
MHI – Marine Hydrophysical Institute of National Academy of Sciences of Ukraine (NASU), Sevastopol, Ukraine
MNR – Ministry of Natural Resources of Russian Federation
PC – Permissible Concentration of pollutants in bottom sediments
UkrSCES – Ukrainian Scientific Center of Ecology of the Sea, Ministry of the Environment Protection, Odessa, Ukraine
SCHME BAS - Special Center on Hydrometeorology and Environmental Monitoring of the Black and Azov Seas of North-Caucasian Regional Division of Roshydromet, Sochi, Russia
SIO RAS – P.P. Shirshov Institute of Oceanology of Russian Academy of Sciences, Moscow, Russia
SB SIO RAS – Southern Branch of P.P. Shirshov Institute of Oceanology of Russian Academy of Sciences, Gelendzhik, Russia
SOI – State Oceanographic Institute, Moscow, Russia
SSC RAS – South Scientific Center of Russian Academy of Sciences, Rostov-on-Don, Russia
SST – sea surface temperature
SSS – sea surface salinity
UNEP – United Nations Environment Programme
TACIS – Technical Assistance for the Commonwealth of Independent States, a programme implemented by European Commission
YugNIRO - Southern Scientific Research Institute of Marine Fisheries and Oceanography, Kerch, Ukraine
Some Russian and English Geographical Names
| Name in Russian | Name in English | Name in Russian | Name in English |
|---|---|---|---|
| Крым | Crimea | Тамань | Taman |
| Ак-Бурун мыс | Ak-Burun Cape | Азовское море | Azov Sea |
| Арабатский залив | Arabatskaya Bay | Ахиллеон мыс | Ahilleon Cape |
| Аршинцевская коса | Arshintsev Spit | Береговой поселок | Beregovoy village |
| Аршинцево город | Arshintsevo town | Динский залив | Dinsky Bay |
| Героевское поселок | Geroevskoe village | Железный Рог мыс | Iron Horn Cape |
| Еникале мыс | Enikale Cape | Ильич поселок | Ilyich village |
| Жуковка поселок | Zhukovka | ||
| Заветное поселок | Zavetnoe village | Кавказ порт | Caucasus port |
| Казантип мыс | Cazantip Cape | Кучугуры поселок | Cuchuguru village |
| Казантип бухта | Cazantip Bay | Панагия мыс | Panagia Cape |
| Камыш-Бурун мыс | Camush-Burun Cape | Приазовский поселок | Priazovsky village |
| Камыш-Бурун бухта | Camush-Burun Bight | Приморский поселок | Primorsky village |
| Капканы поселок | Capkanu village | Сенной поселок | Sennoy village |
| Керчь бухта | Kerch Bight (KB) | Тамань город (станица) | Taman town (village) |
| Керчь город | Kerch city | Таманский п-ов | Taman Peninsula |
| Керченский пролив | Kerch Strait (KS) | Таманский залив | Taman Bay |
| Крым порт | Crimea port | Темрюкский залив | Temruk Bay |
| Курортное поселок | Curortnoe village | Темрюк порт | Temruk harbour |
| Малый мыс | Malyi Cape | Тузла остров | Tuzla Island (TI) |
| Набережное поселок | Nabereznoe village | Тузла коса | Tuzla Spit (TS) |
| Опасное поселок | Opasnoe village | Тузла мыс | Tuzla Cape |
| Павловский мыс | Pavlovsky Cape | Чушка коса | Chushka Spit (ChS) |
| Подмаячный поселок | Podmayachnuy village | ||
| Сипягино поселок | Sipyagino village | ||
| Такиль мыс | Takil Cape | ||
| Фонарь мыс | Light Cape | ||
| Хрони мыс | Hrony Cape | ||
| Церковная банка | Zerkovnaya bank | ||
| Черное море | Black Sea |
On 10 and 11 November 2007 a strong storm hit the Kerch Strait located between Ukraine in the West and Russia in the East (Fig.1), and linking the Sea of Azov with the Black Sea. Extremely severe conditions totaling 9 hours lasted from 5:00 AM till 2:00 PM on 11 November. Winds exceeding 30 m/sec produced the over 4 meter-high waves in the waters where the depth varied from 7 to 12 meters only.
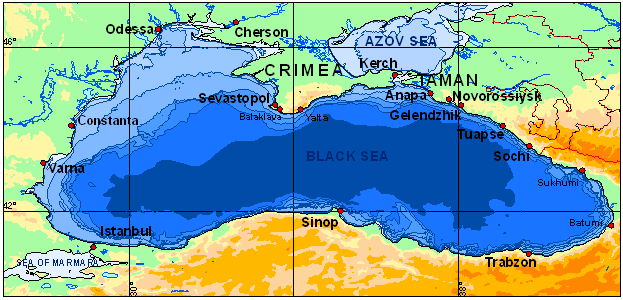
Fig. 1. The Black Sea and main ports
During the storm, 167 boats were on the strait and in its vicinity, while most of them were anchored. No doubt, that the weather conditions experienced by the region at that moment were most unusual and largely unexpected, and, on top of it, a number of vessels had ignored Ukrainian and Russian strong weather warnings and found themselves in the extreme and dangerous sea conditions. Besides, the vessels were mostly poorly equipped[4] for a stormy weather and could not cope with the waves exceeding 2-2.5 meters.
As a result, the gravest mass accident and boat loss for the whole post-Second World War history occurred on the Kerch Strait. Several persons died or went missing despite of the most efficient SAR (Search and Rescue) effort immediately organized.
The vessels that were at the Southern end of the strait within the zone of the raid load-unload regions[5] were caught in an extremely difficult situation. The waves reaching 5.4 m height and arriving from the Black Sea were taking tankers and dry-cargo carriers away from their anchors to wash them aground at the Kerch and Taman peninsulas. In total, thirteen boats[6] suffered an accident as a result of the storm, and of them four dry-cargo carriers and one tanker sank[7] (Fig. 2).

Photo: The storm on 11th of November, 2007, http://englishrussia.com/index.php/2007/11/13/storm-hdr/
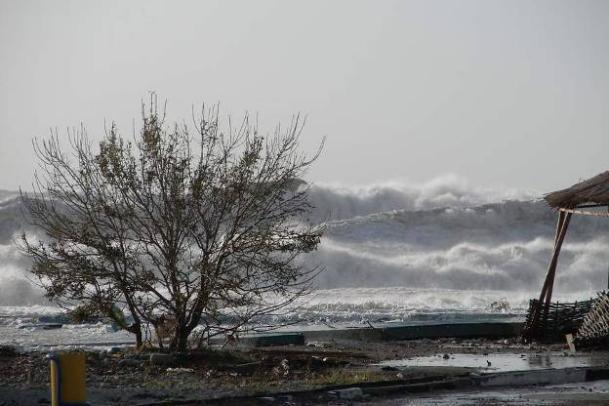
Photo: The high waves nearby Novorossiysk on 11th November 2007, by Alexander Kuznetsov.
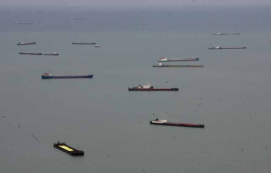

Photo: Berths and a queue of ships at anchorage in the southern part of the Kerch Strait (Booklet, 2009).
The SAR (search and rescue) operations were unique, dangerous and difficult due to the gale wind up to 35 m/s and heavy waves. Russian and Ukrainian SAR units were engaged in real self-denial operations. Helicopters could not take part in rescuing people due to the stormy weather conditions. Despite of all, 35 crewmembers from four ships had been salvaged and hospitalized. Eight people from the sunken vessel Nahichevan did not survive - four sailors were found dead on shore two days later, four went missing.
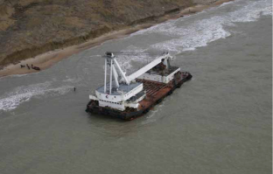
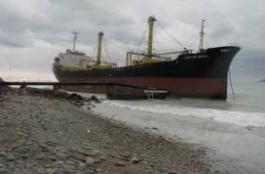
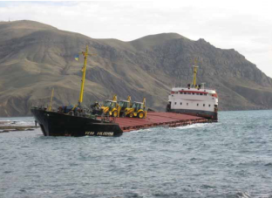
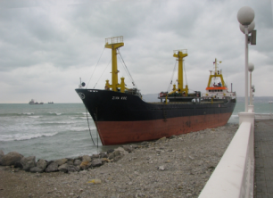
Photo: The Sevastopolets floating crane in the Kerch Strait, the Captain Ismael dry cargo ship stranded in Novorossiysk, the Vera Voloshina cargo ship aground in Crimea and Ziya Koc dry cargo ship in Novorossiysk, photo re-drawn from Booklet, 2009, and by Alexander Kuznetsov.
The Vologoneft-139 motor tanker and the Volnogorsk, Nahichevan and Kovel dry-cargo motor vessels anchored in the Kerch Strait were virtually torn apart by the storm. The Volgoneft-139 boat broke into-two and bow sank in vicinity of the main ship channel of the Strait at the 10 m depth. The stern section drifted by wind to north and touch the ground at 45O15’5 N and 36O31’8 E. From this tanker having leaked about 1.300 tons of heavy fuel[8], and it happened approximately five km to the West from the Tuzla Spit (Fig. 2). An immediate attempt to prevent oil from leaking from the wreck by using booms appeared to be unsuccessful due to the currents prevailing on the Strait. Shortly afterwards, the spill hit the coasts of Russia and later of Ukraine. Large amounts of heavy fuel oil mixed with algae covered the shore trapping and killing thousands of birds.
The other motor vessels of Volnogorsk (loaded with 2,437 t of granulated sulfur), Nahichevan (2366 t) and Kovel (1923 t) did not sink immediately, but drifted towards the coast of Ukraine to the South from the Tuzla Island. It was later reported that the sulfur granulates discharged to the sea floor had been leaked from the Kovel motor vessel. The m/v Volnogorsk sank at 45O11’6 N and 36O31’8 E at the depth of 11 m. All the crewmembers (8 persons) left on the life raft. The Neptunia sea tug (Ukraine flagged ) was sent to the life raft. The Nahichevan motor vessel sank at 45O12’0 N and 36O33’3 E; Kovel sank at 45O09’1 N and 36O26’6 E (Fig. 2).
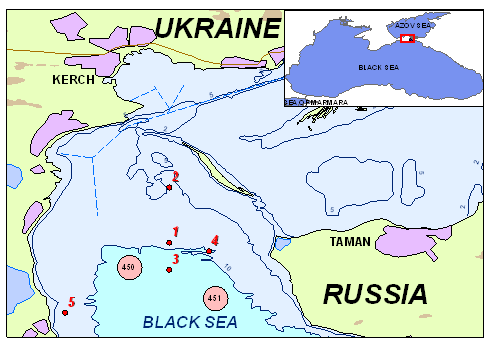
Fig. 2. Map of the areas where the ships sank in the Kerch Strait on 11 November 2007: the Volgoneft-139 tanker bow (point 1) and stern (point 2; 45O15’5 N and 36O31’8 E), Volnogorsk (3; 45O11’6 N and 36O31’8 E), Nahichevan (4; 45O12’0 N and 36O33’3 E) and Kovel (5; 45O09’1 N and 36O26’6 E). Transshipment areas Nos 450 and 451 are marked in red.
When the Captain of the Kerch Port, Mr. Valentin Pilipenko got informed about the fate of Volgoneft-139 and Volgoneft-123, he immediately decided to evacuate all vessels in distress to the Northern part of the Kerch Strait. In this unique operation, under limited visibility and stormy wind (up to 35 m/s), 47 vessels were successfully navigated to a safer place passing the Strait.
Initially, the Black Sea Regional Contingency Plan (www.blacksea-commission.org) was not activated[9]. Russia and Ukraine did not ask for international assistance to tackle the oil pollution accident and planned to cope with the disaster by means of their own oil spill response reserves. However, many international organizations volunteered to render a help, while many people around the world got truly worried about the potential aftereffects of the Kerch accident and were ready to go to Russia or Ukraine to participate in the wild-life rescue effort and on-coast cleaning operations. As of 17 November 2007, hundreds of workers from the Ukrainian and Russian Ministries of Emergencies, civilian volunteers and representatives of international organizations were involved in the shoreline clean-up and rescue operations.
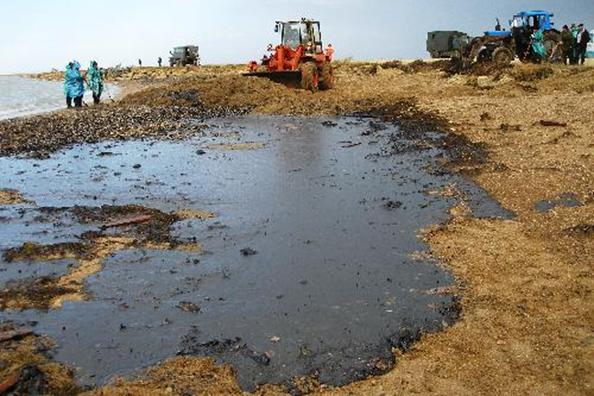
Photo: November 12, 2007, oil patches on the Tuzla Spit, http://www.flickr.com/photos/.
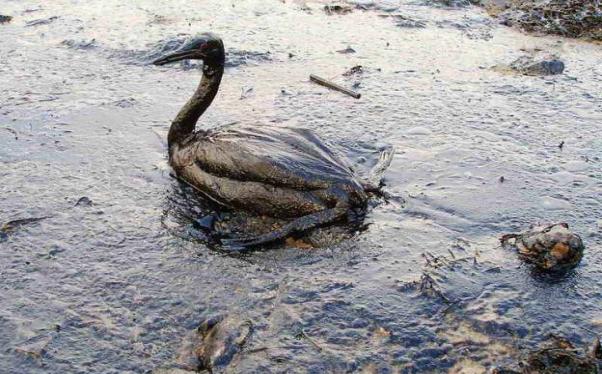
Photos: A bird stained with fuel oil sits at the shore near Russia's port Caucasus (published by Reuters: Mr. Alexander Natruskin), photo of Igor Golubenkov (NGO: Saving Taman, http://www.flickr.com/photos/).

Photo: Military forces engaged in clean-up operations on the coast, by Igor Golubenkov (NGO: Saving Taman), November 12, 2007, on Tuzla Spit, http://www.flickr.com/photos/.
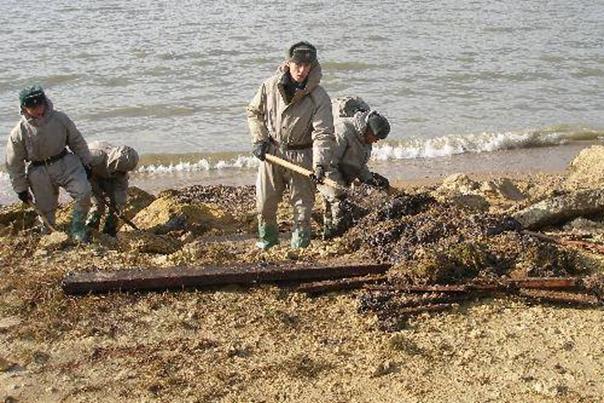
Photo: Clean-up operations on the coast, by Igor Golubenkov (NGO: Saving Taman), November 12, 2007, on Tuzla Spit, http://www.flickr.com/photos/.
Regardless of that effort, the accident became considered as an ecological catastrophe, one of the worst in the region and the gravest since the early 1990s (when a tragic accident of the M/T Nassia tanker happened on 13 March 1994: see http://www.cedre.fr/). Despite of all the sea and land response operations carried out to halt oil pollution, the expectations emerged that the consequences of the accident would be felt for several years on – environmentally and socio-economically. A number of public institutions and agencies jointly with commercial companies got engaged in determining the damage inflicted on the ecosystems. Their produced figures and numbers were enormous and varied by more than three orders of magnitude to range from tens of millions to hundreds of billion roubles, while Ukraine was initially about to claim billions of USD from Russia in compensation for its sustained damage.
Many central TV and radio channels presenters kept informing the public in their news blocks about the rescue efforts and measures taken to reduce the sustained damage. Newspapers kept reporting conflicting figures and forecasts, and some of them were expecting the oil slick to reach the coasts of other Black Sea states as well by means of the currents.
It became both necessary and apparent to determine as soon as possible potential ways of spreading of the oil and sulfur discharged into the sea, as well as the actual and potential impact of these hazardous substances on the ecosystem conditions in the region of the Strait and adjacent water space both at the time straight after the accident, and for a longer-term period. A number of organizations from different agencies both in Russia and Ukraine in the course of the first several days following the accident had managed to carry out an initial oil-fuel spread assessment. Further on, during 2008-2009 numerous scientific institutes conducted complex observations in the Kerch Strait and adjacent water space of the Black and Azov Seas to assess the state of the environment and impact of the Kerch accident. In carrying out the environmental analyses and economic assessment the EC and UNEP participated as well.
The Kerch accident became the most studied oil spill event in the world – numerous inspection trips on coast and at-sea and more than 60 complex cruises were organized, and millions were spent for the post-disaster needs assessment. Numerous papers, brochures and books were published, and certain are still planned for publication in Russian and Ukrainian. Herewith, we would rather analyze and summarize vast volumes of published and unpublished data, and information materials compiled during more than two years after the accident that have consolidated the view points of different Russian and Ukrainian public and academic authorities, why the Kerch disaster happened, as well as about its impact and lessons learnt.
The present monograph carries information and data about the sequence of events, contingency plans activated for the post-accident response to include the cleanup operations and remediation activities, emergency phase monitoring as well as numerous complex ecological observations carried out afterwards during the period of 14 November 2007-December 2009. As well, it describes meteorological conditions prevalent within duration of the extreme storm, characteristics of the wind waves and sea currents predominant at the time of the accident, pollution-zone parameters received through mathematical simulations jointly with aerial and visual observations, results of the satellite surveys over the surface waters and coasts pollution extent within the accident area, and the operational monitoring data on the land and the sea. Analysis of pollution dynamics in the Kerch Strait and its adjacent sea space for the two years that have passed since the time of the accident (water, bottom sediment and biota in November 2007 - December 2009) is presented. A detailed complex assessment of the Kerch catastrophe magnitude and its impact on the coast and marine environment is included also. So far, the monograph remains the most complete compilation of available materials and data collected in the Black Sea region after the accident. How accidental was this disaster, which has had such a negative effect on the recreational image of the northern Black Sea coast? Who is to blame for the wrecks - the traffic controllers, the owner of the ship or the charter party? What is the level of oil spill pollution preparedness and prevention in the Black Sea region? The book answers all these questions and many others.
Summing up their research results, the authors consider the experience received in the course of assessment of an emergency situation produced by the Kerch Strait accident. Also, lessons learnt during and after the Kerch disaster would contribute to enhancing the shipping safety standards, building stronger prevention and preparedness effort in the Black Sea region in case of an oil pollution accident and improve regional cooperation in emergency situations at the sea.
Chapter 1. History Of Regular Observations Over The Kerch Strait And The Data Sets Available
Eremeev V., Ivanov V., Ilyin Yu., Trotsenko B., Shlyakhov V.
Research on the Kerch Strait hydrology and water dynamics started in the late 19-early 20 century, and these long-term observations and assessment results became summarized by the end of 1950 (Azov Sea, 1962). Further studies on the Kerch Strait water dynamics were carried out by SOI (Moscow) and its Sevastopol branch[10] under the supervision of E. Altman7 in 1960-1980. The results of those studies were presented by several papers to be summarized in a monograph (Simonov A.I., Altman E.N., 1991) to include large bibliography on the subject. Presently, regular observations are carried out at the strait Northern narrowest part at the Crimea-Caucasus cross-section by the Opasnoe hydro-meteorological station, HMS personnel.
Regular research on the hydro-chemical regime and water pollution levels of the Kerch Strait started in the late 1970s. The monograph (Azov Sea, 1986) describes the hydro-chemical regime of the Kerch Strait and adjacent area of the Azov Sea till the mid-1980s. The publications (Ilyin Yu.P. et al., 2000, Ilyin Yu.P. et al., 2001) contain substantial information about the water pollution levels and contaminant flows from the Azov Sea to the Black Sea based on the observations conducted at the Kerch Strait Northern narrowest part during the 1990s. Yet, it has been never published a comprehensive and full overview of pollution of the Kerch Strait taking it for an independent geographical unit. Hence, no long-term trends of water quality recorded during the 30 years of observations are available.
A vast archive of the observation data collected in the Kerch Strait is kept at MB UHMI (Sevastopol) and it contains the following data:
a) Meteorological, the water temperature and salinity, sea level, waves, and ice formation data collected by the coastal network of marine hydro-meteorological stations and posts at the Kerch Strait, and adjacent areas of the Black and Azov Seas during the period 1945-2009 (Opasnoe, Kerch, Zavetnoe, Mysovoe, Taman, Feodosiya);
b) Results of hydrological and oceanographic research conducted in the framework of various programs in 1962-2009. These materials contain results of the inspection-trip observations, including measurements of flows, discharges, and ice-condition surveys. The MB UHMI database contains 285 sets of the currents regular measurements taken by autonomous buoy stations with a period of observation ranging from 12 hours to 10 days and with a time-step from 5 to 30 minutes. A large dataset of currents (by current-meters) and discharges measurements is available for different areas of the strait.
c) Over 800 records of measurement of water discharges, and heat and salt exchanges collected at the narrowest Northern part of the Kerch Strait during 1957-2009.
d) Field and processed data seasonally collected in 1957-2009 on the Azov Sea by the Kerch Strait and in the Northern narrowest part of the strait at the Crimea–Caucuses cross-section include: levels of concentration of dissolved oxygen (O2), pH, alkalinity (Alk), phosphates (P-PO4) and total phosphorus (Ptotal), silicates (Si), nitrites (N-NO2) and nitrates (N-NO3) ammonia (N-NH4), and total nitrogen, as well as certain pollutants, such as hydrogen sulfide, total petroleum hydrocarbons (TPHs), detergents, phenols and organo-chlorine pesticides.
Since 1999, regular observations are carried out in the Ukrainian section of the Northern narrowest part of the Kerch Strait by HMS Opasnoe at four (N 6, 7, 8, 9, Fig. 1a) out of seven earlier functioning stations of standard transect only. Since the early 1990s, an economic recession and lack of equipment have made monitoring impossible in the other parts of the Kerch Strait where it was previously conducted in the Kerch and Camush-Burun Bights of the Southern part of the strait, as well as in the Azov and Black Seas adjacent areas.
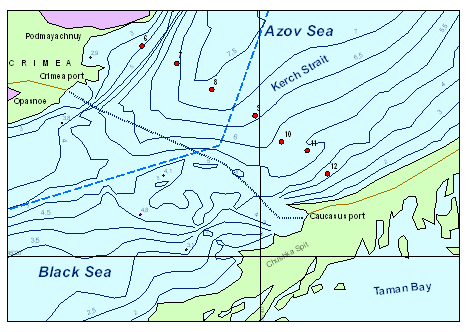
Fig. 1a. The bathymetry of the narrowest place in the northern part of the Kerch Strait and ferry between ports Crimea and Caucasus (the dot line across the Strait). Red squares – monitoring stations.
YugNIRO monitors the ecosystem of the Kerch Strait since 1955 within the framework of the former USSR, and since 1991 - under the governance of the Hydromet Services of Ukraine. For a long time, the monitoring was complex, conducted seasonally during oceanographic surveys in the Black and Azov Seas (Fig. 1b).
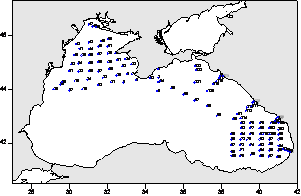
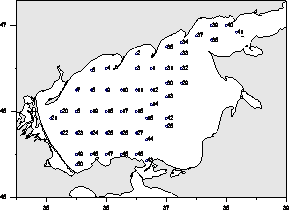
Fig. 1b. Sampling stations of YugNIRO (AzCherNIRO) in the Black and Azov Seas in period 1955-1996.
Since 1996 the monitoring of the Kerch Strait was limited to the area of 44°50`-45°29`N / 36°21`-37°00`E, Fig. 1c, covering 412 stations during 140 expeditions. Meteorological, hydrological and hydrochemical observations have been carried out at standard depths, together with collection of specific information. Since 2002, monitoring with a different level of complexity was conducted mainly in the central and Southern parts of the Strait, and at the Kerch and Camush-Burun Bights (Fig. 1d).

Fig. 1c. Sampling stations of YugNIRO (AzCherNIRO) in the Kerch Strait.
Presently, an integrated regular monitoring of water, bottom sediments and biota are required to trace the impacts of increasing anthropogenic pressure on the ecosystem of the Strait, including dredging in the navigation channel, commerce and fishing ports, dumping of dredged materials, increase in shipping, transshipment in ports and outside of ports, exploration and extraction of oil at areas close to the Strait.
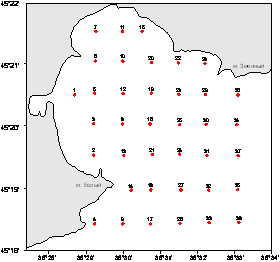

Fig. 1d. Sampling stations of YugNIRO (AzCherNIRO) at the Kerch and Camush-Burun Bights.
Chapter 2. Morphology And Bathymetry Of The Kerch Strait
Eremeev V., Ivanov V., Ilyin Yu., Trotsenko B., Kochetkov V.
The Kerch Strait linking the Black and Azov Seas plays an important role in the formation of hydrological and hydro-chemical peculiarities of the whole Azov-Black Seas Basin. In ancient times the area was known as the Cimmerian Bosporus (Photo).

Photo of picture: View across the Kerch Strait in 1839, by Ivan Aivazovsky.
The most important harbor along the coasts of the Kerch Strait is the Crimean city of Kerch which gives its name to the Strait. The Russian side of the Strait contains the Taman Bay encircled by the Tuzla Spit to the south and Chushka Spit to the north. The most important settlement on the Russian side is Taman where an important cargo port is under construction.
Due to its intermediate position between the two seas, the Kerch Strait water regime, coast morphology, bathymetry, sediments distribution and other geo-morphological parameters have significantly varied with time. The changes in the form and depths of the strait and adjacent areas of the Crimea, and especially of the Taman Peninsula, have become particularly significant, while certain elements of their present shoreline do not appear on historical maps, for example, the Tuzla Island (Fig. 2a, 2b).
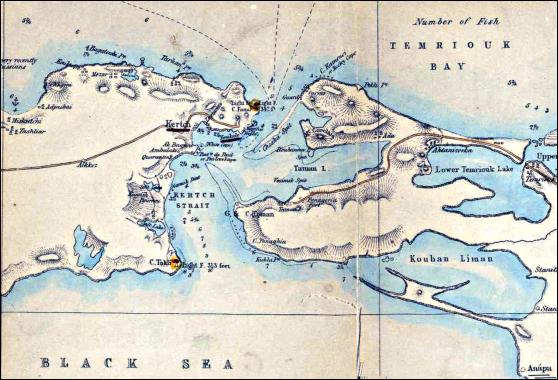
Fig. 2a. The Kerch Strait on the Stanford's Map of the Sea of Azov, 1855 [http://nla.gov.au/nla.map-rm341].

Fig. 2b. The modern state of the Kerch Strait shoreline and bathymetry.
The length of the Kerch Strait is about 43 km along a straight line and it is 5 km longer along the fairway (navigating channel). The width of the strait varies substantially from 3.7 km to 42 km. The Strait is shallow. Its maximum depth is 10.5 m at the Azov Sea entrance and 18 m from the Black Sea side. Its depth gradually decreases closer to the middle of the Strait, where large areas are no more than 5.5 m deep (Fig. 1a). The total area of the Kerch Strait is about 805 sq km, while the total water volume is 4.56 cub km.
Major portions of the Kerch Strait are blocked by shoals of mud. Regular dredging is required to keep the vital modern shipping routes open between the Black Sea and the Sea of Azov. For instance, in the Kerch Strait 21,000,000 m3 of soil were dredged and dumped in the time period from 1991 to 1997.
The coast of the Taman peninsula is a complex mixture of abrasive shores with rather well developed sandy accumulated structures like Chushka and Tuzla Spits, and some others.
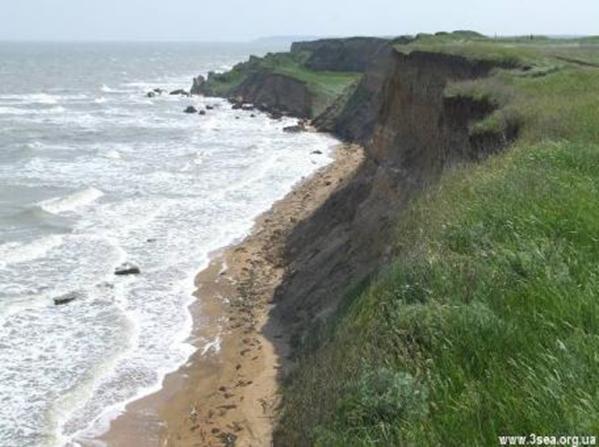
Photo: Abrasive coasts of the Kerch Strait.
The shore section of 22 km long from the Yantarny village up to the Panagia Cape is of abrasion nature. There is only small area from the Yantarny village to the Solenoe Lake where the shore is of accumulative origin. The shore section of 7 km long from the Panagia Cape to the Tuzla Cape is again of abrasion form. There are land slides there. The width of the beach here varies from 1 m to 10 m. There are two types of deposits there at the beach: sandy and sandy-gravel with exposure of base breed. The Tuzla Cape shore up to the distant end of the Tuzla Spit stretching for 7 km is of accumulative nature. The beach width here is of 1 m to 40 m. The width of the spit is 100 m -150 m. The spit was formed with limestone with the base of detritus and coquina (shelly ground).
The shoreline of the Taman and Dinsky Bays stretching for 85 km is flat and covered with reeds. Only the northern slope of the Taman Bay is of abrasion nature.
The shore from the Chushka spit to the Ilyich village of 18 km long is of accumulative origin. The distant end of the Spit is formed with coarse-grained detritus sand and large parts of beaten coquina. The eastern shore of the Spit is covered with the layer of seaweed of 30-64 centimeters thick and partially covered with reeds. From the Ilyich village to the Pekla Cape, the shore of 16 km long is of abrasion nature and there are landslides. The beach here is sandy with rocks at the base. There are wide sandy beaches at this section of the shore.
The bottom sediments particle size analysis clear indicates the dominance of coarse sand in the central part of the Kerch Strait (Fig. 2c). Accumulation of fine muddy particles (clay soil, silty soil) is expected only in the Kerch Bight and Taman Bay. The main stream from the Azov to the Black Sea along the strait axis washes constantly small particles from the bottom decreasing the transparency of the sea water.

Fig. 2c. Particle size analysis of bottom sediments in the central part of the Kerch Strait in May 2005.
Chapter 3. Background Hydro-Meteorological Conditions Of The Kerch Strait Area
Ovsienko S., Fashchuk D., Zatsepa S., Ivchenko A., Petrenko O., Ilyin Yu., Yurenko Yu., Postnov A., Fomin V., Repetin L., Diakov N., Lavrova O.
3.1. Atmospheric circulation
3.2. Stormy winds at the North-Eastern Black Sea
3.3. Waves generated by wind
3.4. Stormy events at the Black sea
3.5. Thermophile conditions
3.6. Water dynamics
3.7. Water exchange between the Black and Azov Seas
3.8. Fluctuations of the sea level
3.9. Ice coverage
3.10. Evolution and movement of the Tuzla Island sediment
3.11. Conclusions
In the marine environment, movements and transformations of pollutants are known to be affected by certain hydro-meteorological factors that are primarily wind, the waves, water circulation and temperature, and ice conditions. Therefore, in order to estimate the magnitude of abnormality of the November 11, 2007 storm and to understand the general (background and baseline) pollution dynamics, analysis was conducted of the Kerch Strait hydro-meteorological regime based on its long-time observation.
Data collected in 1945-2009 during observations carried out along the Kerch Strait shores by the Opasnoe HMS, the Kerch AMS in the Zavetnoe village and at the Black Sea by the Anapa HMS give ground to determine two opposite wind flows (transfers) blowing into the North-Eastern-Eastern and South-South-Western directions. Each of them got formed under the influence of a specific type of atmospheric process taking place over the Black Sea area (Chernyakova A.P., 1965, Eremeev V.N. et al., 2003).
On the annual basis, the Northern (N), North-Eastern (NE), and South-Western (SW) types of flow (transfer) have a higher frequency of 11-13%. The frequency seasonal maximum of the N, NE (25-28%) and SW (15-25%) types is observed during the winter months. Frequencies of other flow (transfer) types correspond to the other wind directions and equally spread through the year not exceeding 8% per month. Northern winds dominate on the Kerch Strait with development of the N and NE types of flow (transfer), while among the Southern winds, those with the SW type of flows (transfer) prevail.
During 11-18 November 2007, a distinct SW wind flow was registered at the time of the atmospheric masses spread-over from the Baltic Sea to the Balkans and development in the Black Sea region of powerful Southern cyclones accompanied by the strong S and SW winds (Anapa, S, 20-35 m/sec; Novorossiysk, SE-SW, 17-22 m/sec). In the North-Eastern part of the Black Sea, the winds have usual maximum velocity exceeding 15 m/sec once a year during the October-April period. Strong winds could last for 10-13 hours in average. For instance, in November 2007, that type of wind was observed by the Kerch AMS during the 8-hour period. However, the probability of the SW type of transfer to be witnessed at the Kerch Strait in October-April does not exceed 12% to be followed by 7-9% for the NW and N flows (Simonov A.I., Altman E.N., 1991). For this time of the year, the most probable would be the NE type of wind with a maximum velocity of 20-25 m/sec. Besides, analysis of the wind gradation distributions has showed that storms with wind velocity exceeding 20 m/sec could be witnessed in 1-3% of the cases observed (in specific situations over the Black Sea and with certain wind directions), (Simonov A.I., Altman E.N., 1991). No information has been present in the bibliography since 1936 about the storms similar to the one observed during the Kerch accident in November 2007, which apparently happened to become a very rare combination of factors with a disastrous aftereffect.
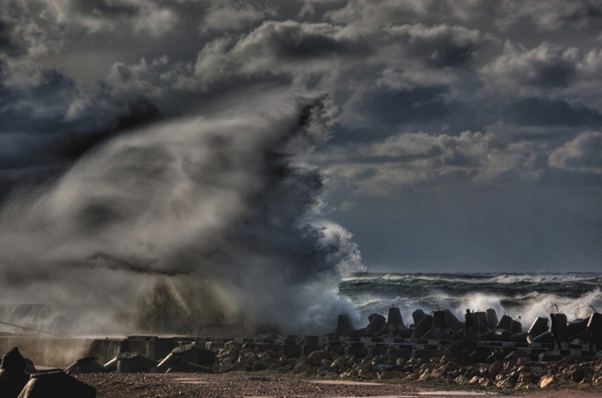
Photo: The storm on 11th of November, 2007, http://englishrussia.com/index.php/2007/11/13/storm-hdr/
3.2. Stormy winds at the North-Eastern Black Sea
The North-Eastern Black Sea is an energy-generating area of the Black–Azov Seas region and is well known for its higher storm activity as compared to the other areas. Occurrence of stormy winds is summarized in Table 3.2a and at Figure 3.2a.
Table 3.2a. Occurrence (%) of stormy winds (11-30 m/sec) per direction registered by the coastal stations and in the open shelf area of the North-Eastern Black Sea.
| Area | N | NE | E | SE | S | SW | W | SE |
| Feodosia | 0.10 | 0.51 | 0.26 | 0.02 | 0.47 | 0.46 | 0.40 | 0.47 |
| Zavetnoe | 0.38 | 1.50 | 0.14 | 0.05 | 0.29 | 0.11 | 0.18 | 0.13 |
| Opasnoe | 0.50 | 2.35 | 1.42 | 0.01 | 0.34 | 0.11 | 0.45 | 0.11 |
| Taman’ | 0.98 | 2.76 | 2.55 | 0.09 | 0.68 | 0.16 | 0.52 | 0.38 |
| Anapa | 0.68 | 2.47 | 2.36 | 0.11 | 3.37 | 0.61 | 0.88 | 0.57 |
| Open Sea | 0.60 | 4.45 | 1.84 | 1.01 | 1.3 | 0.79 | 1.25 | 0.16 |
The Kerch Strait and the Black Sea open-shelf North-Western wind diagram for the winds exceeding 10 m/sec shows predominance of the North-Eastern, Eastern and Southern winds (Fig. 3.2a).
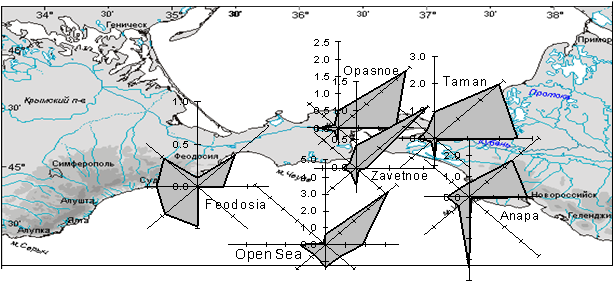
Fig. 3.2a. Wind diagram of the stormy winds (11–30 m/sec) annual observations (%) by the shelf and coastal stations in the North-Eastern Black Sea.
During the year, the Anapa off-shelf area experiences 42 days with winds exceeding 10 m/sec in average, and inter-annually their number varies from 10-15 to 50-70 days. Strong winds are observed through the whole year during all the seasons. In order to avoid the influence of coastal topography on seasonal variability of the stormy winds (11–30 m/sec), their monthly frequency for the near-Kerch open-sea area of the Black Sea was calculated based on the atmospheric pressure data of last 38 years of observations by the Hydrometeorological stations network. While the North-Eastern and Eastern winds prevail during the year with frequency of 19% and 15%, respectively (Fig. 3.2b) the period of strong winds (≥15 m/sec) highest frequency (>3%) continues from December to March reaching its maximum in January-February (6.6%).
Although the Northern, North-Eastern and Eastern stormy winds (> 10 m/sec) typically come from the coast, their velocity (of up to 35-40 m/sec) and relatively high frequency (up to 7% in total) can produce a dangerous impact on the hydro-technical facilities and boats to contribute to the build-up of strong wind currents and waves.
However, the most dangerous wind directions in the near-Kerch sea areas and on the Southern Kerch Strait are the South-Western, Southern and South-Eastern. Though their annual average frequency is low (0.14% for SE, 0.08% for S and 0.37% for SW), in February it may increase to 0.82% for SE, 0.28% for S and 0.37% for SW. Despite of an observed relatively low frequency in regard to the Southern strong winds (3% in this area in total), there could be occasionally observed the exceptionally powerful South-Eastern and Southern stormy winds reaching a hurricane speed and producing extremely high wind waves with a large development distance.
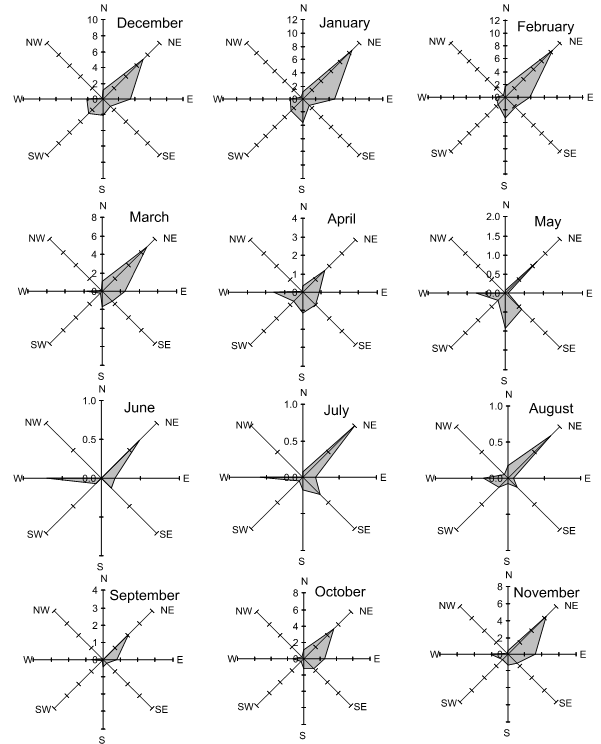
Fig. 3.2b. Monthly wind frequency (%) diagram of the stormy winds (10-30 m/sec) in the near-Kerch area, North-Eastern Black Sea.

Photo: The storm on 11th of November 2007, http://englishrussia.com/index.php/2007/11/13/storm-hdr/
In 1954-2002, the wave height long-term observations were conducted three times a day (two times in the winter period) by the Opasnoe HMS through using a wave recorder (Eremeev V.N. et al., 2003). The annual and monthly wave height average has showed the dominance of the N, NE and SW waves direction (see Tabs. 3.3a, 3.3b, 3.3c). It was also clear that high waves reaching up to 1.2-2.0 m were observed in the Kerch Strait narrowest part rather occasionally, while the N and NE wave directions prevailed. Maximum wave height of 2-3 m was observed nine times in total (six times in April, two - in June, and one - in July) in the Northern part of the strait and under the Northern winds influence. Thus, the four m high waves brought by the impact of the Southern winds, as it was recorded by the Caucasus port in November 2007, had not been observed on the Strait during almost 50 years of observations. The 0.7-1.0 m high waves usually prevail through the whole year round (44-51% cases) except for March. The wave 1-2 m high frequency varies through the year from 1 to 7.3% reaching the maximum in October–February (Eremeev V.N. et al., 2003).
Annual average frequencies of waves are given in Table 3.3a based on long-term monthly observations over the wave direction and height gradation registered by the Opasnoe HMS during the period of 1954-2002. The wave subtotal probability and height frequency are given in Table 3.3b.
As the table shows, waves of the Northern, North-Eastern and South-Western directions prevail in the Northern narrowest part of the strait. The maximum observed wave heights are summed up in Table 3.3c. Based on the observation data, it is apparent that the wave 1.8-2.0 m major heights in the Northern narrowest part of the strait are observed occasionally and usually under the Northern and North-Eastern direction disturbance impact that generate the most dangerous waves.
Table 3.3a. Long-term monthly and annual frequency of the wave height gradation (m): number of cases (cases) and percentage for the period of 1954-2002 given by the Opasnoe HMS.
| Waves height (m) | Month | I | II | III | IV | V | VI | VII | VIII | IX | X | XI | XII | Year |
| ≤0.2 | cases | 1166 | 426 | 1272 | 2178 | 2428 | 2416 | 2450 | 2228 | 1819 | 1490 | 1355 | 1392 | 20620 |
| % | 49.9 | 49.2 | 48.6 | 54.4 | 53.8 | 55.2 | 54.2 | 49.3 | 48.0 | 47.7 | 47.3 | 48.7 | 50.9 | |
| 0.3-0.7 | cases | 969 | 381 | 1148 | 1767 | 1951 | 1916 | 1932 | 2124 | 1743 | 1399 | 1255 | 1217 | 17802 |
| % | 41.5 | 44 | 5.8 | 44.2 | 43.2 | 43.8 | 42.7 | 47.0 | 46.0 | 44.8 | 43.8 | 42.5 | 44.0 | |
| 0.8-1.2 | cases | 167 | 59 | 151 | 115 | 114 | 45 | 137 | 161 | 211 | 219 | 208 | 196 | 1783 |
| % | 7.2 | 6.8 | 5.8 | 2.9 | 2.5 | 1.0 | 3.0 | 3.6 | 5.6 | 7.0 | 7.3 | 6.9 | 4.4 | |
| 1.3-1.9 | cases | 33 | 0 | 45 | 33 | 21 | 0 | 0 | 9 | 14 | 15 | 48 | 56 | 274 |
| % | 1.4 | 0.0 | 1.7 | 0.8 | 0.5 | 0.0 | 0.0 | 0.2 | 0.4 | 0.5 | 1.7 | 2.0 | 0.7 | |
| 2.0-3.0 | cases | 0 | 0 | 0 | 6 | 0 | 2 | 1 | 0 | 0 | 0 | 0 | 0 | 9 |
| % | 0.0 | 0.0 | 0.0 | 0.1 | 0.0 | 0.0 | 0.0 | 0.0 | 0.0 | 0.0 | 0.0 | 0.0 | 0.0 |
Table 3.3b. Annual averages of the wave-height gradation frequency (m) per direction, number of cases (cases) and percentage for the period of 1954-2002 given by the Opasnoe HMS. The wave height frequency subtotal and the regime probability.
| Gradation | direction | N | NE | E | SE | S | SW | W | NW | Frequency | Probability |
| Still | cases | 1950 | 100 | ||||||||
| % | 4.8 | ||||||||||
| ≤0.2 | cases | 2980 | 2393 | 932 | 614 | 2583 | 3169 | 3037 | 2962 | 18760 | 95.2 |
| % | 7.4 | 5.9 | 2.3 | 1.5 | 6.4 | 7.8 | 7.5 | 7.3 | 46.1 | ||
| 0.3-0.7 | cases | 3019 | 6641 | 1597 | 387 | 2447 | 1706 | 883 | 1122 | 17802 | 49.1 |
| % | 7.5 | 16.4 | 3.9 | 1.0 | 6.0 | 4.2 | 2.2 | 2.8 | 44.0 | ||
| 0.8-1.2 | cases | 77 | 1228 | 352 | 10 | 74 | 15 | 10 | 17 | 1783 | 5.1 |
| % | 0.2 | 3.0 | 0.9 | 0.0 | 0.2 | 0.0 | 0.0 | 0.0 | 4.4 | ||
| 1.3-1.9 | cases | 6 | 210 | 50 | 1 | 7 | 0 | 0 | 0 | 274 | 0.7 |
| % | 0.0 | 0.5 | 0.0 | 0.0 | 0.0 | 0.0 | 0.0 | 0.0 | 0.7 | ||
| 2.0-3.0 | cases | 2 | 4 | 3 | 0 | 0 | 0 | 0 | 0 | 9 | 0.0 |
| % | 0.0 | 0.0 | 0.0 | 0.0 | 0.0 | 0.0 | 0.0 | 0.0 | 0.0 | ||
| Total | cases | 6084 | 10476 | 2934 | 1012 | 5111 | 4890 | 3930 | 4101 | 40488 | |
| % | 15.0 | 25.9 | 7.2 | 2.5 | 12.6 | 12.1 | 9.7 | 10.1 | 100.0 | ||
Table 3.3c. The wave height maximum (m) observed on the Kerch Strait by the Opasnoe HMS during the period of 1954-2002 (Eremeev V.N. et al., 2003).
| Month | Year | ||||||||||||
| I | II | III | IV | V | VI | VII | VIII | IX | X | XI | XII | ||
| Height (m) | 1.6 | 1.6 | 1.8 | 2.0 | 1.8 | 2.0 | 2.0 | 1.3 | 1.3 | 1.8 | 1.4 | 1.6 | 2.0 |
| Wind direction | N, NE | NE | NE | NE | E, NE | NE | N | NE | NE | E, NE | N | NE | NE, N |
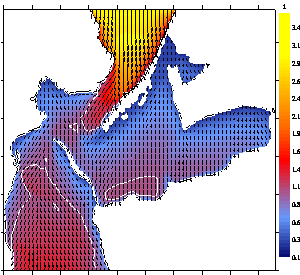
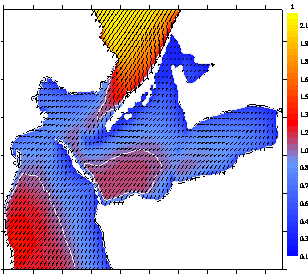
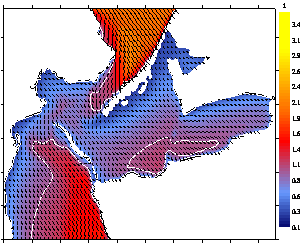
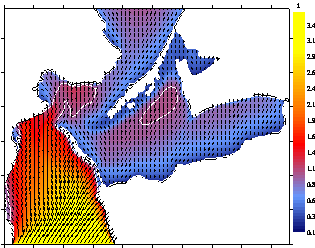
The mathematical modeling results (the numerical model applied is described in (Ilyin Yu. et al., 2009) for the Kerch Strait wave fields are given in Fig. 3.3a. Those simulated were the wind speeds of 15 m/sec on a numerical grid with a horizontal resolution of 150 m for the four prevailing wind directions, i.e., the North-Eastern, Northern, North-Western and the Southern (Fig. 3.3a), (Oceanographical Atlas of the Black and Azov Seas, 2009).
|
|
||||
|
|
Fig.3.3a, b, c, d. Significant wave heights (m) and mean wave directions on the Kerch Strait for the Northern (a), North-Eastern (b), North-Western (c) and the Southern winds (d).
3.4. Stormy events at the Black sea
The autumn cyclones to happen once in every seven-ten years differ from the usual cyclones, and produce the most destructive impact on the Black Sea in its North–Eastern parts in particular. Usually, they cross the sea basin in November during the period of the autumn air cooling when the water temperature still remains relatively high. Even a century and a half ago, the navigators considered those cyclones similar to the tropical ones by the origin, characteristic features and aftereffects.

Photo: Storm in the Black Sea, http://englishrussia.com/index.php/2007/11/13/storm-hdr/
One of those events happened to be “The Balaklava Gale” to brake-out off the Crimean South-Western coast on 14th November (new style calendar) 1854 during the Crimean War. Ivashintsev (1855) wrote in his paper: “It happened so, that there were no traces of the terrible storm along the Western shore... Odessa did not suffer from the hurricane“. According to reports of shipmasters and from the shore-based posts, the storm velocity was 30 km per hour. The storm radius equaled to 90 miles. The highest wind velocity was 35 m per second, which equals to 72 Italian miles per hour. Twenty-one English ships were lost, and together with the ships navigating in other parts of the sea, the number of lost ships reached 30 (or 34 in other papers). Some English ships crushed near the Chersoneses Cape, at the mouth of Cacha River, close to Yevpatoriya. Almost 1 500 men died and the loss suffered totaled at 60 million Franks. The history has witnessed not too many examples of a simultaneous loss of such number of first-class ships. In the English history the date “14th November 1854“ and the name “Balaklava“ became synonyms of the word “catastrophe“. The Balaklava storm has been memorized by the locals and in the historical chronicles also because of the death of the three-mast propeller steamship The Black Prince (Booklet, 2009), which carried a golden treasure.
It is worth mentioning that on the next day a cold, clear weather settled down, which correlated well with the meteorological data about a cold front passage.
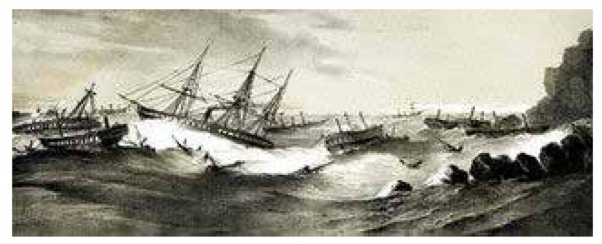
Photo: B.F. Timm. Crush of the Turkish-Anglo-French navy near Balaklava, during the storm, November 1854. Lithography. A collection of R.Ya. Shterengarts. Moscow. Taken from the web site http://chekist-07.boom.ru/balaklava/zametki/shtorm.htm
The storm on 28-29 January 1968 was also considered to be among the strongest on the Eastern Black Sea by its intensity, duration, coverage area and consequences (Ikonnikova L.I. 1977; Zdanov A.M. et al., 1968). That outbreak of cyclonic activity over the Black Sea followed on a build-up of a deep stationary cyclone (985 hPa in the centre) between two anticyclones – a warm one in the South-East (over the Caucasus) and a cold one in the North-West of Europe. The wind over the Black Sea proper was controlled by a secondary cyclone which had formed over the Asia Minor in the Southern part of the stationary cyclone and was moving to the Black Sea gradually deepening to 990 hPa in the centre. That secondary cyclone crossed the Turkish Anatolia coast at a speed of 50 km/h and reached the Kerch Strait on 28 January 1968. During the night of 27-28 January, the wind velocity had sharply increased and the westerly near the Turkish coast reached 30-34 m/sec with a windy zone exceeding 100 km in radius. Following the cyclone trajectory, the zone jointly with the hurricane winds moved towards the Kerch Strait extending to the whole Black Sea. The winds blew at a speed of 20-30 m/sec in the Black Sea interior and up to 35 m/sec by the Crimean Peninsula. The maximum wind speed (30-34 m/sec) zone reached the Caucasian coast by the evening of 28 January. That storm was unusual due to occurrence of the long waves which caused a 1.5-m sea-level rise at the Caucasian coast, and 9-10 m wind waves that crashed at the Sochi pier producing the 30-40 m high splashes (Zdanov A.M. et al., 1968). In their result, the coastal railway and houses were over flooded.
A similar storm brought by a Southern cyclone, though accompanied by a smaller decrease in the atmospheric pressure, occurred on 12-16 November 1981. During that storm the cyclone centre stayed over the Crimea for three days. The isobars and its followed geotropic wind flow on the Eastern storm periphery rushed to the Kerch Strait in parallel to the Caucasus Mountains. The wind reached its maximum over the North-Eastern Black Sea.
In recent times, a similar storm on 14-16 November 1992 inflicted a heavy material loss to result in destruction of the oil and gas rigs in the North-Western Black Sea, and concrete constructions, while washing away the sand from the beaches in the Odessa City and in the Crimea areas (Fig. 1a).
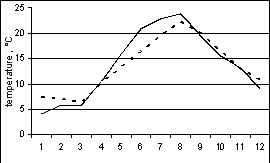
The sea surface water temperature (SST) of the Kerch Strait varies from 00С to 2-40С in winter and from 220С to 290С in summer. The minimum average SST of the strait is observed in January and of the bottom layers - in March. In March, the water warm-up starts jointly with seasonal formation of a thermocline in which the gradients are maximum in June. The maximal temperature of the water column is registered in August, when the vertical gradients have slowly disappeared and the water keeps its homogeneity until December (Eremeev V.N. et al., 2003). In the Northern part of the strait (the Opasnoe HMS), the minimum SST of 1.00С is observed in February and the maximum of 24.10С is recorded in July-August (both values are long-term monthly averages, Table 3.5a, Fig. 3.5a). The water seasonal fluctuations are generally typical for shallow water space of the middle-latitude seas.
Table 3.5a. The monthly average water temperature at the surface of the Kerch Strait Northern Part (measured by the Opasnoe HMS), (Eremeev V.N. et al., 2003).
| Month | Year | |||||||||||
| I | II | III | IV | V | VI | VII | VIII | IX | X | XI | XII | |
| 1.9 | 1.0 | 2.5 | 8.0 | 15.3 | 21.1 | 24.1 | 24.1 | 20.1 | 14.3 | 9.0 | 4.6 | 12.2 |
 |
 |
Fig. 3.5a. Annual fluctuation of water temperature °С (a) and salinity ‰ (b) averaged for the Kerch Strait water space and shown at the surface (solid line) and the near-bottom (dotted line) layers.
An average sea surface salinity (SSS) of the Strait varies from 14‰ in June to 18.2‰ in January and November. However, the minimal salinity level of the bottom layer is observed in April and October. In January and November salinity does not change from the surface to the bottom layers.
In the result of the Azov water outflow, the annual average salinity of the Black Sea coastal waters in the proximity of the Kerch Strait remains the lowest for the whole Black Sea being 13.52‰, which is 1.2‰ lower the average salinity level recorded in the North-Western part of the Black Sea, though the latter is strongly influenced by the Danube river run-off, as well as by the Ukrainian large rivers (Dniepr, Dniestr, Southern Bug). In the Kerch Strait Northern part at the entrance to the Azov Sea the water salinity levels could fluctuate in the range of 11.3-18.42‰ within a number of days due to a Black Sea water outflow.
The Kerch Strait water exchange with the Black Sea is determined by the wind flows over the strait jointly with the Azov Sea geographical and physical peculiarities. The exchange takes place by means of an effective reciprocal movement through the strait cross-section that results from the water level difference of the Northern (the Azov Sea) and Southern (the Black Sea) parts. The difference in the level depends on the rivers discharge into the Azov Sea and wind flows. The wind flow and stormy winds impact on the sea level is stronger than the rivers influence - on the average 5-6 times and 10-15 times, correspondingly. Thus, winds build-up short-term and the rivers - long-term oscillations of the Azov and Black Seas water exchange.
With the Northern winds prevalence, the strait sea level slopes towards the Black Sea and the so called ‘Azov’ type flows build-up (Fig.3.6a). The flow velocity increases from 0.1 m/sec to 0.4 m/sec following the waters progressive movement from the Azov Sea to the Northern narrowest part of the Kerch Strait. During those short, high and rapid water flow intrusions, the Northern narrowest part could not release all the accumulating in front of it volumes, and in that case the opposite direction currents build-up in the water bottom layers along the Russian shoreline (back towards the Azov Sea). Simultaneously, the bottom current average velocity may go up to 0.7-0.8 m/sec. Due to the morphological peculiarities of the strait by the Tuzla Island, the water velocity there remains always below 0.4 m/sec. After Tuzla the water flows get wider towards the Black Sea drifting later into the Crimea shoreline direction. The water slows down to 0.1 m/sec before entering the Black Sea.
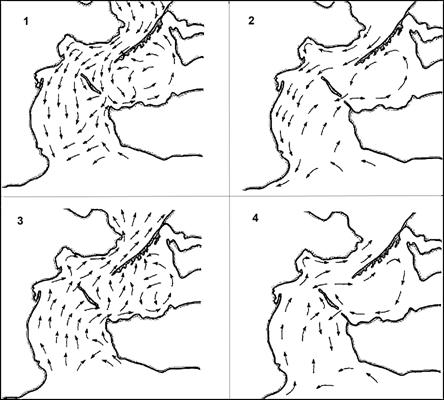
Fig. 3.6а. The Kerch Strait water flows impacted by the Northern wind flow (Azov) are given above, and the Southern wind flow (Black Sea) is given below; before construction of the Tuzla dyke (left) and after the construction (right) as observed in autumn 2003.
The water level slopes from the Black to the Azov Sea under the impact of the winds blowing from the South and the so called ‘Black Sea’ flow type builds-up (Fig. 3.6a). While the flow progresses towards the central part of the Kerch Strait, the sea current velocity increases from 0.1 m/sec to 0.4 m/sec (no more than 0.4 m/sec at Tuzla).
After leaving the Tuzla gully, the Black Sea waters fill in the central part of the Strait. The main stream heads to the North while partially entering the Kerch Bay. The sea current velocity could exceed 0.4 m/sec in the Northern narrowest part, but slows down after it, when entering the Azov Sea. Small gyres may appear due to the Kerch Strait and its islands geomorphologic complexity, as well as variability of the wind fields. Those gyres could reach 4-6 km in diameter in the Northern part of the strait, while being of a 1-2 km diameter in its Southern part. The currents velocity could be 0.7–0.8 m/sec in the narrow passes and to average of 0.25-0.3 m/sec. A usual currents velocity does not exceed 0.4–0.5 m/sec, while averaging 0.1–0.3 m/sec in the wider sections (Altman E.N., 1987, Panov B.N., Rubinshtein I.G., 1989 Eremeev V.N. et al., 2003).
The recurrence of the ‘Azov’ flows to the Black Sea average 58% annually and, consequently, the flows from the Black Sea sustain 42%. Under the Northern winds impact, duration of the continuous flows from the Azov Sea could reach 300 hours and impacted by the Southern winds flows from the Black Sea could last for up to 200 hours. Mixed flows could be observed for 6-10 hours on the average. Annually, the ‘Azov’ flows are generated during 208 days in total, the ‘Black Sea’ - 135 days, and mixed flows - 22 days (all the numbers are long-term averages from 1962 till 2006). On the monthly scale, the numbers are 18, 11, and 2 days, respectively.
Serious changes occurred to the Kerch Strait water circulation after the Tuzla dyke construction in 2003 and the sediment formation and abrasion rate were the first to experience the impact. Results of satellite observations over the Kerch Strait flows and visual surveillance conducted over the shoreline dynamics in 2003–2007 have shown that the water flows velocity along the Crimean sea coast increases significantly under the impact of the Northern and North-Eastern winds, since the waters from the Azov Sea are prevented by the dyke from spreading evenly within the strait area (Borovskaya R.V., 2005). As a result, along the coastline from the city of Kerch to the Takil Cape many sand beaches (going by 10-20 m deep into the mainland) were washed away during three years after the dyke construction (2004–2007).
Satellite pictures provide convincing evidences that the Tuzla dyke construction has generally changed water circulation in the Kerch Strait. Under the impact of the Southern winds, the Black Sea water falls into the Taman Bay having passed through the Pavlov Pass only, i.e., through a pit along the Strait (the Tuzla Island – the Chushka Spit) and not through the Tuzla gully. As a result and under the Southern winds impact, a typical cyclone-type circulation (counterclockwise) for the bay area changes into its opposite - an anti-cyclonic, which contributes to accumulation of suspended particles in the bay to eventually result in its silting. In addition, the dyke unfinished construction presents an obstacle for the Black Sea flows and triggers Southern development of reverse flows along the Taman coastline under the Southern winds impact, as well as a local anti-cyclonic gyre build-up in the strait Southern part (from the Black Sea side of the dyke).
3.7. Water exchange between the Black and Azov Seas
According to the annual average long-term data from 1923 till 1985, the water flow from the Azov to the Black Sea through the Kerch Strait is 49.8 cub km/year having a maximum of 71.2 cub km/year (142% of the average were observed in 1979) and a minimum of 35.2 cub km/year (71% of the average were observed in 1973). The water flow from the Black Sea averages 33.4 cub km and varies from 20.6 cub km registered in 1923 to 46.3 cub km/year reached in 1949, i.e., from 63% to 138% of the long-term annual average, respectively. The produced water exchange is directed from the Azov to the Black Sea and averagely sustains 16.4 cub km/year, while its maximum of 48.8 cub km was reached in 1932 and the minimum of 2.0 cub km was registered in 1973. The reached maximum sustained 299% of the annual average (Altman E.N., 1987, Ilyin Yu.P, Lipchenko M.M., Dyakov N.N., 2003).
The water volumes discharged from the Black to the Azov Sea are most often larger (Simonov A.I., Altman E.N., 1991), except for spring (March-May) when the situation becomes different: discharges from the Azov to the Black Sea become prevalent (340–860 m3/sec). This phenomenon is caused by regime of the two main rivers falling into the Azov Sea, being the Don and the Cuban. Jointly with the winds they play an important role in generating sea currents during the spring time, while the rivers high waters increase velocity of the currents from the Azov to the Black Sea. Furthermore, due to the flows higher frequency from the Azov to the Black Sea, the annually prevailing currents direction is from the Azov Sea bringing, as a result, 12-14 cub km/year of Azov water to the Black Sea on the yearly basis, calculated on data from 1923 till 1999 (Eremeev V.N. et al., 2003).
A stable slowdown of the outflow from the Azov to the Black Sea was observed from 1912 to 1975, when the Azov Sea water balance sustained 28.6; 22.3; 10.6 and 5.5 cub km/year for the periods of 1912–1922; 1941–1945; 1966–1975; and 1971–1975, accordingly (Remizova S.S., 1984). Based on the recent field observations available (data collected by the Opasnoe HMS), an annual average discharge from the Black Sea registered in the Northern part of the Kerch Strait sustains 3,900 m3/sec, while the Azov Sea discharge sustains 3,500 m3/sec.
Still, the resulting flow is directed from the Azov to the Black Sea to sustain around 12 cub km/year considering the flow annual average frequency. The resulting flow estimation deriving from the Azov sea water balance equation for the period after the rivers overregulation gives a slightly higher number of about 14 cub km/year, while its fluctuations mainly depend upon the Don and Cuban rivers decreased water discharge (Table 3.7a), (Eremeev V.N. et al., 2003).
Table 3.7a. The Azov Sea fresh-water balance and the resulting flow through the Kerch Strait (Eremeev V.N. et al., 2003).
| Period of averaging | 1923-1998 | 1923-1950 | 1951-1998 | Changes |
| Rivers discharge, cub km | 36.5 | 40.5 | 34.7 | -5.8 |
| Precipitation, cub km | 15.2 | 15.0 | 15.3 | +0.3 |
| Evaporation, cub km | 33.0 | 33.3 | 32.9 | -0.4 |
| Resulting flow through the Kerch Strait, cub km | 16.2 | 20.5 | 14.2 | -6.3 |
3.8. Fluctuations of the sea level
The Kerch Strait sea level fluctuations vary by nature. The most significant in terms of their impact are the wind driven downward and upward fluctuations, while the seasonal and climatic-scope fluctuations produce the reasonably smaller amplitudes. Annually the sea level fluctuations in the Kerch Strait demonstrate a well expressed seasonal variability to reach the maximum in June and the minimum – in October. The span of those seasonal fluctuations roughly reaches 25 cm. The biggest through the year sea level changes could be registered in January-February in the Northern part of the Strait, while in its Southern part – in February-March and they are triggered by a strong sea storm activity in those places during the mentioned months. The smallest sea level changes in the Kerch Strait could be observed in August-September (Eremeev V.N. et al., 2003).
The sea level long-term fluctuations are largely related to the changes in discharge from the rivers of the Azov-Black Sea basin and substantially exceed their seasonal parameters to reach 35-40 cm. Generally, the year-to-year fluctuations experienced by the Azov-Black Sea basin show a stable tendency of increase (1.4 - 1.7 mm/year).
Winds are the main reason for the Kerch Strait sea level meso-scale fluctuations. Their produced downward and upward fluctuations affect the sea level smooth seasonal changes through exceeding their average amplitude by 5-6 times, while reaching 8-10 times when the storm is very strong. Downward and upward fluctuations are the most often observed in the Kerch Strait Northern part under the impact of the North-Eastern wind having the highest frequency, strength and duration. On the Strait, the most dangerous conditions for the catastrophic sea level rises in such synoptic situations are those, when the Northern winds blow at the Azov Sea Northern coast, the North-Western winds – at the North-Western coast and the Western winds – at the South of the sea. The Northern narrowest part of the Kerch Strait is the border for expansion of the sea level disturbance produced by the Azov Sea downward and upward fluctuations. The Strait part to the South is affected by the Black Sea level changes. It’s worth mentioning that under the impact of extreme upward fluctuations - that happen nearly once in 50 years - large parts of the Tuzla Spit could be over flooded. Energy generated by high waves in the course of the upward fluctuations is well known to be crucial for erosion of the Kerch Strait accumulative formations (Eremeev V.N. et al., 2003).
The Kerch strait freezes every year. However, the ice cover appears late and it is thinner on the Strait than at the Azov Sea due to the influence of the warmer waters coming from the Black Sea.
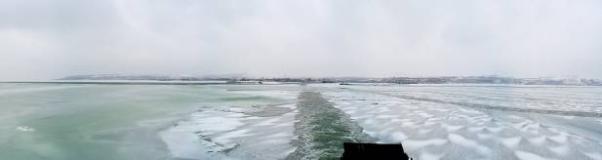
Photo: The Kerch Strait in winter 2006, by Michael Khmelkov.
A standard practice for the winter type classification (mild, moderate and severe) is applied for the ice conditions analysis through taking into consideration the total sum of the daily air temperatures above the sea level during the icy seasons. The ice-condition main characteristics including specific dates and the ice coverage duration in the Kerch Strait Northern part (counted dependant on the winter type) are given in Table 3.9a (Eremeev V.N. et al., 2003).
Statistically, based on the Opasnoe HMS long-term observations that have an 80% probability, the ice cover formation starts on the Kerch Strait on 11 January. This ice formation date could vary from 1 to 30 January depending upon a severe or mild winter, accordingly. During the moderate and mild winters, complete ice cover on the strait does not occur, while it may happen by 20 January during severe winters. Still, solid and continuous ice cover appears in the strait Northern part up to the Tuzla Island only, and the thickness of the fast shore ice could be of 10 cm in the Kerch inlet. Ice is usually more solid on the Taman Bay and could be 30 cm thick reaching up to 65 cm during severe winters. Ice there is mainly of local origin. It occurs in mid- or late December and forms a fixed solid stable cover during the first decade of January. The Taman Bay is not covered with ice all-over. Complete ice melting with probability of 80% happens around 8 March. It may happen three weeks later (29 March) during a severe winter or two weeks earlier (23 February), if the winter is mild.
Table 3.9a. Average dates and probability (Р, %) of ice phenomena on the Kerch Strait for the period of 1944-2003 (the Opasnoe HMS), (Eremeev V.N. et al., 2003).
| Ice phenomena | Winter type | Average | ||||||
| Severe | Moderate | Mild | ||||||
| Date | Р | Date | Р | Date | Р | Date | Р | |
| First ice formation | 01.01 | 100 | 03.01 | 100 | 30.01 | 57 | 11.01 | 80 |
| Stable ice formation | 12.01 | 100 | 13.01 | 65 | 23.01 | 18 | 14.01 | 49 |
| Beginning of a fast-shore ice formation | 15.01 | 82 | 09.01 | 40 | 17.01 | 11 | 12.01 | 34 |
| First complete freezing | 13.01 | 91 | 20.01 | 80 | 27.01 | 14 | 18.01 | 51 |
| Final freezing | 20.01 | 27 | - | 5 | - | 0 | 28.01 | 7 |
| Beginning of the fast-shore ice breaking | 25.02 | 73 | 06.02 | 35 | 02.02 | 7 | 14.02 | 29 |
| End of the fast-shore ice breaking | 10.03 | 100 | 24.02 | 95 | 18.02 | 29 | 27.02 | 64 |
| Final ice free | 29.03 | 100 | 07.03 | 100 | 23.02 | 57 | 08.03 | 80 |
Sometimes in winter the Strait recurrent re-opening and freezing could happen. For example, with the North-Eastern winds and severe frosts arriving, the Strait starts acquiring relatively solid ice coverage, while with the Southern winds blowing it could become free from solid ice quite fast.
Strong Northern and North-Eastern winds build-up large accumulations of cohesive and hummocky ice (up to 4 points by the 5-point scale) at the strait Northern entrance that impede the navigation. Due to the ice potential sliding, the most dangerous for the strait navigation in winter is the turn from the Chushka to the Camush-Burun ranges, the Zerkovnaya bank area, and the North-Eastern end of the Tuzla Island (Eremeev V.N. et al., 2003).
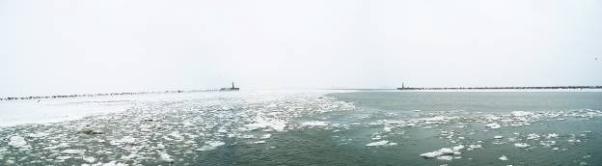
Photo: The entrance to the Port of Crimea in winter 2006, by Michael Khmelkov.
The winter 2008 was abnormally cold, similar to 2006, and the Azov Sea got covered by ice with thickness of 35-45 cm. In port Caucasus the ice was 5-10 cm. In January 2008 the air temperatures were among the lowest observed since 1891 in the area – below -23°C and often the weather was stormy with low visibility in the sea. Presently, there are no technologies of oil spill response in waters covered with ice.
3.10. Evolution and movement of the Tuzla Island sediment
Two main streams of sediments could be determined at the Kerch Strait that feed accumulative bodies being the stream in the North by the Chushka Spit and the Southern stream by the Tuzla Island (Fig. 3.10a).
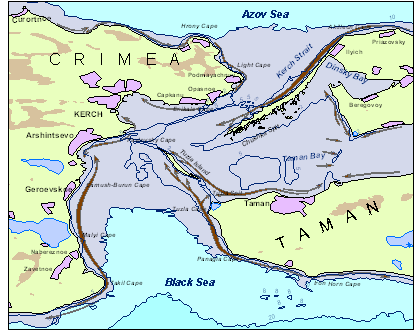
Fig. 3.10a. The main flow of sediments in the Kerch Strait (Boldyrev V.L., 1958). The thickness of arrow corresponds with the power of soil flow.

Photo: The Tuzla Island and the Tuzla Spit.
The Tuzla Spit erosion process to eventually turn the spit into an island has been protracted having started about 300 years ago. Initially, that erosion process seized a radical part of the spit to result in its thinning with a complete outbreak to follow during the Black Sea strong storm on 29 November 1925. The spit erosion material started moving towards its distant end to cause the spit growth and extension in length. After the scour formation, that material was disbursed by the both sides of the spit and the scour seabed, while being partially moved towards the spit distant end. With the scour getting wider and the current within it getting slower, as well as due to the depth reduction by the both sides of the spit resulting from the wash material silt, the spit wash-away rate went substantially down. Due to the high-bed profile by the both sides of the scour, a system of the sand banks fluctuations has emerged (Eremeev V.N. et al., 2003).
Photo: The Tuzla Island, Ukraine (left) & Russia (right). Sea of Azov (top) & the Black Sea bottom), http://www.picsearch.com/info.cgi?q=Kerch&id=4QP1gaxz6kcDtwAQ1Y-2nNeXcL SuRE1e7_ RkriYWcZM&start=1381
The Northern, North-Eastern, Eastern and Southern winds prevail in the near-Kerch area of the Black Sea. Dangerous for navigation, coastal and off-shore hydro-technical constructions, the North-Eastern and Eastern hurricane winds have an average velocity of 30 m/sec, while their gusts exceed 35 m/sec. However, the Southern, South-Western and South-Eastern winds could generate extreme waves provided a larger distance for their formation is available. These winds do not happen often, but possess a stronger destructive potential notorious for bringing natural disasters resulting from the atmospheric circulation in the Kerch area.
Ovsienko S., Fashchuk D., Zatsepa S., Ivchenko A., Petrenko O., Kabatchenko I., Filippov Yu., Yurenko Yu., Ilyin Yu., Chernov V.
4.1. Synoptic situation
4.2. Wave conditions
4.3. Water dynamics of the Kerch Strait and adjacent waters on 11-19 November 2007
4.4. Preliminary assessment of heavy fuel oil characteristics
4.5. Mathematical modeling of the oil spill accident spread on 11-16 November 2007
4.6. Chronology of the storm events on 10-12.11.2007 and the administrative actions to prevent oil pollution
4.7. Consequences of the storm
Storms of a magnitude similar to the Kerch accident may happen in the North-Eastern part of the Black Sea every 10-20 years (Buhanovskiy A.V. et al., 2009). Typically, those catastrophic Black Sea storms are conditioned by a two-center depression with a secondary-cyclone drifting over the sea. Ikonnikova L.I. (1977, 1980) described the mechanisms behind as follows. A thermal depression builds-up over the Black Sea underlying warm surface during the transient and cold seasons of the year. That weak and motionless local disturbance tied to the warm underlying surface becomes a powerful stimulator of cyclogenesis (cyclone-generation). As soon as a Black Sea depression finds itself within the borders of a Southern periphery depression of central cyclone, it starts contributing to a secondary-cyclone build-up. Under those conditions the warm and humid air filling the Black Sea depression rushes to the secondary-cyclone center and rises up. In the meantime, the secondary-low develops as a “thermal” cyclone typical for the tropics and receives through vertical convection an additional energy by using humid instability, and makes an especially strong impact on water dynamics to produce the worst possible coastline and facilities destruction. The critical conditions required to be present for a destructive secondary-cyclone build-up are as follows: The atmospheric pressure in the center has to be lower than 985 hPa, the pressure decrease in three hours – more than 3 hPa, water temperature – higher than 8-9ºС, difference between the water and air temperatures – more than 2ºС, the secondary-cyclone moving velocity - 40-80 km/h and the wind velocity at the surface has to exceed 25 m/sec.
By all the features, the storm of 10-12 November 2007 has to be recognized as one of the most severe and destructive storms on the Black Sea among those with similar synoptic conditions of build-up under the influence of a secondary-cyclone developing as a thermal low.
During the mentioned period, the European part of Russia was under the influence of a broad and deep cyclone with its center slowly drifting along Northern Europe (Fig. 4.1a, b). The cyclone build-up started on 9 November 2007 in the center of a baric depression (972 hPa) spreading from Scandinavia to the South of Western Europe.
On 10 November, a secondary-cyclone emerged over Italy and the Balkans at the South-Western periphery of that area of lower pressure (1,001 hPa in the center, Fig. 4.1b).
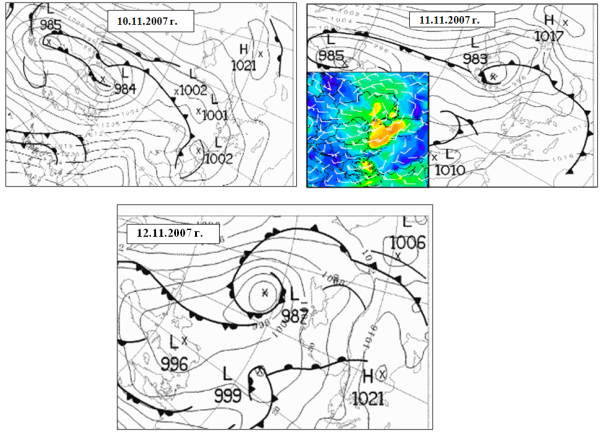
Fig. 4.1a. Evolution of the near-ground baric field and fronts over the Azov-Black Sea basin on 10 November at 00:00, the baric field and the near-ground wind on 11 November at 00:00 and on 12 November 2007. (http://www.wetterzentrale.de, Bracknell).
During the day (from 00:00 GMT on 10 November till 00:00 GMT on 11 November) the secondary-cyclone was drifting from Southern Italy through the Balkan Peninsula and North-Western Turkey in the direction of the Crimean Peninsula advancing by 20 hPa at the velocity of 70 km/h and rushing to the Crimea (Buhanovskiy A.V. et al., 2009; Postnov A.A. ed., 2009). The pressure was down to 983 hPa in the center of the cyclone that had stabilized over the Western part of the Black Sea. The horizontal baric gradients between that cyclone and the anti-cyclone in the South-Eastern part of the sea had gone up to reach 3-4 hPa at the 1º meridian. Over the Western Black Sea area and in the rear of that cyclone, the pressure difference between Varna and the Crimean coast was reaching 27 hPa. The cyclone moving velocity was close to around 80-85 km/h and it was building-up a zone of maximal horizontal baric gradients over the Kerch Strait and the Azov Sea (Fig. 4.1b). The hurricane wind velocity zone (25-32 m/sec, 700 hPa) was encompassing the whole European Continent.

Fig. 4.1b. The storm synoptic conditions over the Black Sea on 11 November 2007: A near the ground baric field, the wind field at the height of 700 hPa and baric topography at the height of 500 hPa. (http://www.westwind.ch).
On the morning of 11 November, the Western wind velocity went up to 25-32 m/sec in the South-Western Crimea zone (Sevastopol), while the height of the waves spreading from the South-West was reaching 3-5 meters at the Cape of Chersonesos (the Chersonesos beacon). Starting from that moment, the zone of hurricane wind velocity adjacent to the cyclone center from the South-East started shifting to the Kerch Strait through the Black Sea along the cyclone trajectory. By mid-day of 11 November, the velocity of the South-South-Western wind had reached 25 m/sec (Feodosia) in the North-Eastern part of the sea, while the high waves in the Southern part of the Kerch Strait were standing at 4-5 meters.
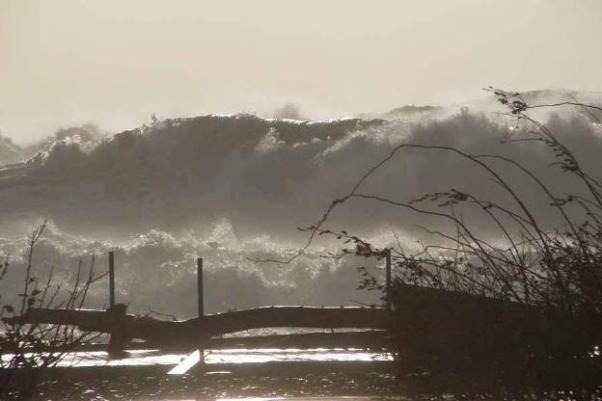
Photo: High waves sea, 11th of November 2007, Novorossiysk, Black Sea, photo by Alexander Kuznetsov.
According to the information provided by the Kerch AMS, in the period of 10-16 November wind directions varied from the South-South-East to the North-West-North and the wind velocity - from still to 20 m/sec (Fig. 4.1c).

Fig. 4.1c. Velocity and direction of wind on 11-16 November, 2007 according to hourly observations of the Kerch AMS.
The North-Caucasian Inter-Regional Territorial Division on Hydrometeorology and Environment Monitoring reported the following on the Azov Sea: During the night of 10-11 November, 2007, the South-Eastern wind increased up to 15-20 m/sec in the period from 1:35 AM to 2:30 AM; then the wind turned to the South-West and its velocity reached 20 m/sec with the gusts of 26 m/sec at 11:20 AM; at the port of Temruk, the South-Eastern wind blew with a speed of 15-20 m/s at 2:30 AM; in the town of Eiysk, the Eastern wind turned its direction to the South and its speed became 15-22 m/sec at 1:35 AM; in the Doljanskaya tiny village (stanitsa), the Eastern wind turned to the South-West blowing at a 16-22 m/sec velocity at 5:40 AM; and the South-Western wind of a 13 m/sec velocity with gusts of 26 m/sec blew at 2:51 PM.
In Anapa (on the Black Sea coast), the Southern wind of a 20-25 m/sec velocity was observed at 2:38 AM; later - of 25 m/sec velocity at 7:40 AM with the gusts of 35 m/sec. In Novorossiysk, the South-Eastern wind turning to the South-West blew with a velocity of 17-22 m/sec at 2:45 AM through 6:00 PM. In Gelendzhik, the South-Eastern wind turning to the South-West blew with a velocity of 12-15 m/sec with the gusts of 17-23 m/sec at 2:40 AM till 5:00 PM; at 4:00 AM its velocity was 25 m/sec. In Djubga, the South-Eastern wind turning to the South-Western direction blew with a velocity of 7-12 m/sec with the gusts of 18-21 m/sec at 6:20 AM.
No wind observations were taken at the Kerch Strait itself. However, the wind field was re-constructed with a certain precision based on the field of pressure data with a 6-hour time step (Fig. 4.1d) and through using the Russian National Wind-Wave Model (Zakharov V.E. et al., 1999, Kabatchenko I.M. et al., 2001, Kabatchenko I.M., 2007, Kabatchenko I.M., Matushevsky G.V., 1998, Ovsienko S.N. et al., 2009).
Based on series of precise calculations, it has been established that on 11 November an average wind velocity had a potential to reach up to 25 m/sec (the gusts were not taken into account) on the Kerch Strait (close to the Tuzla Island) at the noon time. Taking into consideration that the re-construction data gives lower wind velocity in comparison with the observed data (Buhanovskiy A.V. et al., 2009), it is most possible that the real wind velocity was reaching up to 30-35 m/sec on the strait. Similar calculations were received through using the Meso-Scale Atmospheric Model (Peskov B.E., Dmitrieva T.G., 2009). After the storm, the still that happened lasted for the whole night of 12-13 November.

Fig. 4.1d. Wind velocity (m/sec) on the Kerch Strait close to the Tuzla Island through 1-20 November, 2007 according to the calculations based on the field of pressure.
During the described above synoptic situation, the most dangerous disturbance (rough sea, high-waves) occurred by the North-Eastern Black Sea coast, since strong winds blew over the sea along the maximum-high wave fetches. Based on the data presented by the coastal hydro-meteorological stations, HMS located in the Russian section of the Black Sea, waves of more than 3 points (Beaufort number) was observed in the Southern part of the water space (in the vicinity of Sochi) and up to 4 points – in its Northern part (the Anapa-Kerch Strait region) on Saturday, 10 November resulting from the impact of largely Southern and South-Eastern winds of 5-10 m/sec (Fig. 4.2a, b).
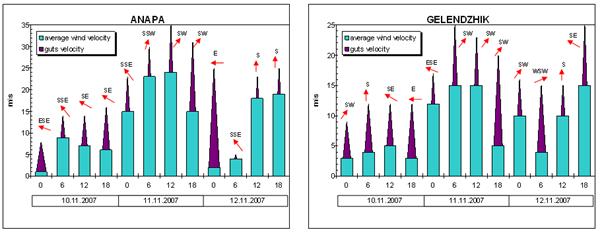

Fig. 4.2a. Wind characteristics based on the observations made (within the standard time) by the coastal HMS on 10-12 November, 2007: average wind velocity (blue) and guts velocity (brick)in Anapa, Tuapse, Gelendzhik and Sochi.

Fig. 4.2b. Wave parameters according to the observations made by the coastal HMS: period and height of waves in Anapa, Gelendzhik and Sochi.
During the night of 10-11 November, the South-Eastern wind increased to 15-25 m/sec, the sea waves – to 4-5 points and the situation continued developing through the whole day of 11 November. Wave height (the wave parameters observed by the coastal HMS are usually taken as secured by the system parameters by 3-5 per cent) at the Sochi coast was reaching 1.5-2.2 meters during the day time, while in the vicinity of Tuapse it was 4.0-4.5 meters from the South and the South-West with a strong gusty Southern wind blowing with a gust velocity of up to 25-30 m/sec. In the region of Anapa and Gelendzhik, the wave height was reaching 3.5-3.7 meters with a strong Western and South-Western wind blowing at the gust velocity of 25-35 m/sec.
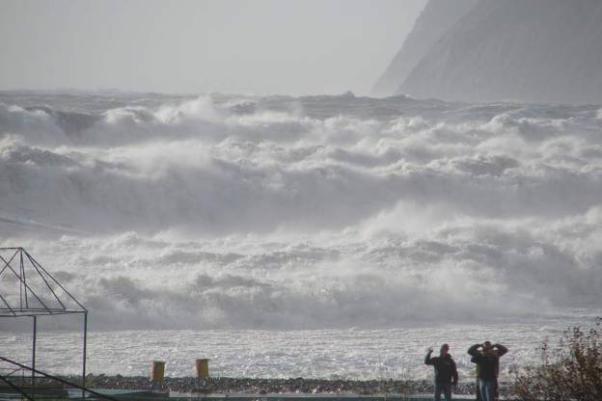
Photo: High waves sea, 11November 2007, Novorossiysk, Black Sea, photo by Alexander Kuznetsov.
In the evening of 11 November the wind went down in Sochi (2-5 m/sec from the Northern bearings); while a high velocity of the South-Western wind continued in the Northern part of the water space reaching 5-15 m/sec at the Tuapse-Gelendzhik section and 15-25 m/sec around Anapa. In the meantime, the sea storm was increasing and during the night of 11-12 November the height of the South-Western and Western waves reached 3.0-3.2 meters at the Sochi coast, and 5.0 and 4.0 meters accordingly at the Tuapse and Gelendzhik coasts. At 18:00 GMT on 11 November 2007, for the first time in the history of observations carried out in the Sochi section, a wave period of 14.8 sec. was recorded, while the wave length at the coast was registered as standing at 106 meters (at the depth of 5.0-5.5 meters)
The storm maximum development phase was characterized by activation of the long-wave dynamics in the sea coastal zone. Thus, based on the registrations made by a depth-gauge installed at the open sea in Sochi, the amplitude growth of the infra-gravitation (long-period) waves started in the day time of 11 November from 10-15 cm to reach by the evening (18:00-20:00 GMT) the height of 35-45 cm. At the same time, the infra-gravitation wave period went down from 10-12 to 3 minutes. According to the depth-gauge observations taken in Tuapse, the amplitude growth of the infra-gravitation waves in the sea-port water space was observed as well during the day time of 11 November to reach its maximum level (40-50 cm) at 14:00-17:00 GMT.
The storm induced high waves during the night of 11-12 November were accompanied by the sea middle-level rise by 20-30 cm (Fig. 4.2c). The water level peak rises at the long-wave crests were reaching the mark over the sea level at 510 cm in Anapa and 495 cm in Tuapse.
The maximum development of the storm was characterized by the activization of the long-waves dynamics in the coastal waters of the sea. According to records of the tide-gauge installed at the open sea shore in Sochi, amplitude growth of long period waves has begun in the afternoon of 11 November starting from 10-15 cm and reaching 35-45 cm by 18-20 GMT. The period of the long period waves decreased from 10-12 minutes to 3 minutes. According to the tide-gauge observations in Tuapse, amplitude growth was observed during 11 November with maximum of 50 cm at 14-17 GMT.
The storm during the night of 11 – 12 November accompanied with the sea level rise of up to 20- 30 cm (Fig. 4.2c). The picks of the sea level rise at the long wave rests reached 510-520 cmcentimeters above the sea level in Sochi and 505-510 cm in Tuapse.
The feature of the storm was intense development of long processes such as “surf beats” in the coastal zone of the sea. Those contributed to increased run-up of storm waves on the shore and the formation of destructive undertow.
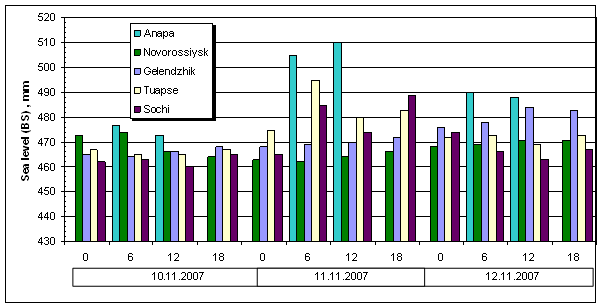
Fig. 4.2c. The sea level characteristics according to the observations made by the coastal HMS.
Thus, the storm’s special feature became an intense development of long-wave processes (“surf-shaken beats” type) in the coastal zone of the sea that contributed to strengthening the storm-wave up-rush to the shore and build-up of a destructive swash. During the day of 12 November, the strong disturbance persisted along all the Black Sea Eastern coastal waters sustained by a 10-25 m/sec storm wind of Southern and South-Western directions. The wave height reached in Sochi 2.0-2.5 m, in Tuapse – 3.0 m, in Gelendzhik – 2.5-3.0 m and in Anapa – 2.0-2.5 m.
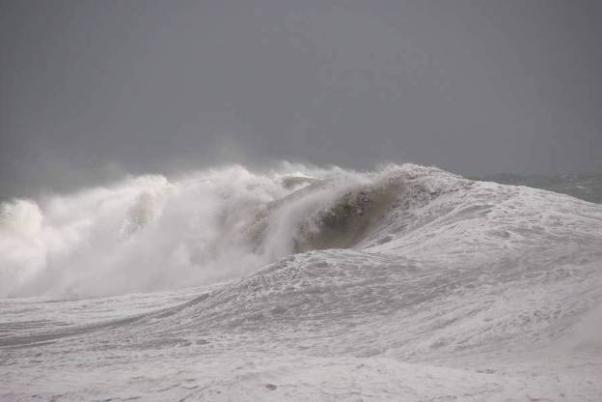
Photo: High waves sea, 11th of November 2007, Novorossiysk, Black Sea, photo by Alexander Kuznetsov.
In line with the METU3 WAVE model (Turkey) calculations, during the 10-12 November storm the waves maximum heights in the deep waters of the open sea exceeded 11 m (h1% ~ 9.0m), (Fig. 4.2d).
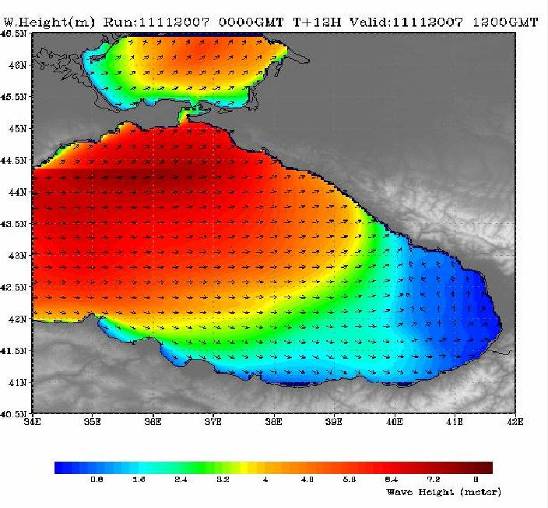
Fig. 4.2d. The wave heights prognostic field for 12:00 GMT on 11 November 2007 calculated through the METU3 WAVE model (Turkey).
Very limited wind waves data was collected during the emergency situation in the Kerch Strait area. According to the reports of the North Caucasus Hydrometeorological Department of Roshydrtomet (NC HMD) and of the South Center of the Russian Federation Ministry of Emergency Situations, on 11 November: At the Temruk port, the waves height was 1.0 m at 9:00 AM; in the Djankoy tiny village (stanitsa), the waves height was 0.5 m at 9:00 AM; in Novorossiysk, the maximum waves height was 4.0 m (time was not specified).
Under those circumstances, the wind waves conditions assessment was based on the mathematical modeling. The Russian National Wind-Waves Model (Zakharov V.E. et al., 1999, Kabatchenko I.M. et al., 2001, Kabatchenko I.M., 2007, Ovsienko S.N. et al., 2009) has produced the following results (Fig. 4.2e): In the Kerch Strait close to the Tuzla Island (from the Black Sea side), the wave height did not exceed 1.5–2.0 m during the period of 1-10 and 13-20 November. In that area the waves reached their maximum height of 4 m on 11 November. At the same time, the wave height reached 7-8 m in the Black Sea at the entrance of the strait, while the wave direction of movement was from the South-West to the North-East (Fig. 4.2f).
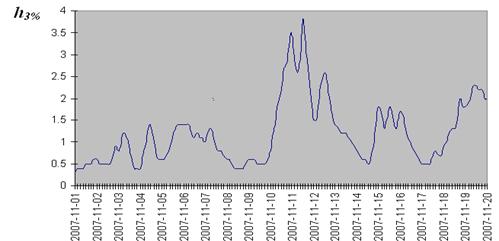
Fig. 4.2e. The waves height dynamics with a 3 per cent probability in the Kerch Strait close to the Tuzla Island in November 2007 (calculations were made through the Russian Wind-Wave Model)
Similar results of the waves height were received for the central part of the Black Sea and areas close to the Kerch Strait through calculations using the Russian Wind-Wave Model (Zakharov V.E. et al., 1999, Kabatchenko I.M., 2007, Ovsienko S.N. et al., 2009).
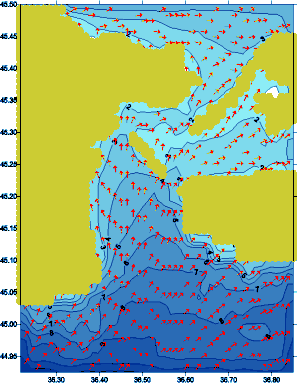
Fig. 4.2f. The field of waves (m) with a 3 per cent probability in the Kerch Strait at 12:00 AM on 11 November 2007. The arrows are the waves movement directions.
4.3. Water dynamics in the Kerch Strait and adjacent waters during the period of 11-19 November 2007
Current fields of the upper layer of the sea presented at the figures were calculated with the hydrodynamic model based on integration of the three dimensional Navier-Stokes equations with explicit-implicit fine definite method (Ivanov K.A., Filippov Yu.G., 1978, Filippov Yu.G., 1997). The water flows in the Kerch Strait during the period of 11-16 November were exclusively directed from the Black to the Azov Sea with branches from the Kerch Strait to the Taman Bay (Fig. 4.3a–4.3b). At the South-Eastern coast of the Azov Sea were observed the South-Eastern and Eastern flows carrying the waters from the North-West to the South-East and further on to the East along the Russian coast. Therefore and due to the water-flow regime existing at the beginning of the Kerch accident and later, no possibilities for the oil spill to enter the Western part of the Azov Sea and to further move to the Ukrainian coast were present.
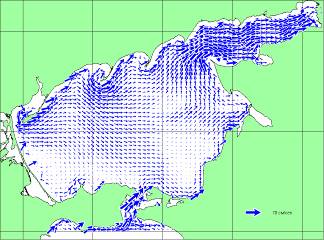
Fig. 4.3a. The field of water flow in the Kerch Strait and adjacent water areas of the Azov and the Black Seas at 12:00 AM (Moscow time) on 11 November 2007. The maximum water velocity at the figure is 0.70 m/sec.
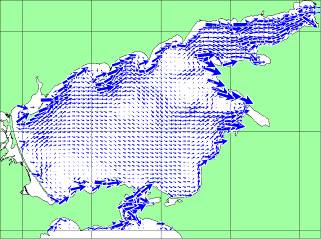
Fig. 4.3b. The field of water flows in the Azov Sea and the Kerch Strait at 12:00 AM (Moscow time) on 16 November 2007. The maximum water velocity at the figure is 0.70 m/sec.
Starting from 17 November and due to the change in wind direction and velocity, the water flows in the Kerch Strait turned to the opposite direction with prevailing inflow from the Azov to the Black Sea and further on to the South-East along the Russian coast (Fig. 4.3c–d). In the South-Eastern part of the Azov Sea, the water flows heading to the South-East and East turned to the opposite direction as well on 17 November, limiting water inflow from the Kerch Strait to the North. At the same time, the waters that had entered the Azov Sea earlier went back to the Strait and hence to the Black Sea.
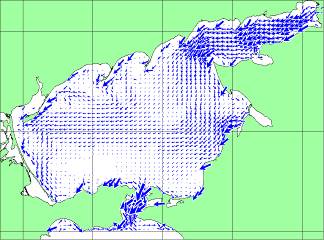
Fig. 4.3c. The field of water flow in the Kerch Strait and adjacent water areas of the Azov and Black Seas at 12:00 AM (Moscow time) on 17 November 2007. The maximum water velocity at the figure is 0.70 m/sec.

Fig. 4.3d. The field of water flow in the Kerch Strait and adjacent water areas of the Azov and the Black Seas at 12:00 AM (Moscow time) on 22 November 2007. The maximum water velocity at the figure is 0.70 m/sec.
4.4. Preliminary assessment of heavy fuel oil characteristics
The preliminary assessment of spreading and diffusion of the Kerch oil spill and respective fine-tuning of consequent seabed contamination were based on very limited data, including no information on the chemical composition of heavy fuel oil transported by the Volgoneft-139 tanker. The assessments and forecasts were needed for rapid organization of response operations.
Estimates were based on the relation between the density of fuel oil and water temperature and salinity within the ranges respectively: 0-25°C and 10-20‰ (Manovjan A.K. 2001). Combining graphs of density for different types of fuel oil (Fig. 4.4a) with density graphs of water in the Kerch Strait in the real for the area ranges of temperature (1-24°C) and salinity (11-18.4‰) allowed making the following conclusions:
1) If the Volgoneft-139 tanker transported the М-100/1015 type fuel oil, then the fuel oil could not raise to the surface because it is denser than water considering the real fluctuations of the water temperature and salinity in the Kerch Strait. It will be denser even if the water temperature rises up to 25°С. Floating of such type of fuel oil is possible only in an unrealistic situation, for instance, if the fuel oil would get warmed up to 22-25°C, and the water temperature at the same time remains within the range of 0 to 7°C.
2) In case the tanker transported the M-100/1000 or M-100/985 type fuel oil, then all petroleum products should have remained on the surface, since at even 20°C temperatures this fuel oil is lighter than water.
3) Fuel oil could rise from the bottom of the Kerch Strait to the surface only, if the Volgoneft-139tanker transported a mixture of M-100/1015, M-100/1000, and M-100/985 fuel oil.
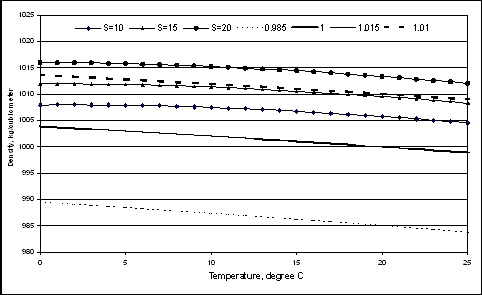
Fig. 4.4a. Correspondence of sea water temperature and density of heavy fuel oil (mazut) at different levels of salinity (10, 15 and 20‰).
It was estimated that in the case of heavy fuel oil surfacing in the open area between the Chushka Spit, Tuzla Island and the Crimean coast, with a probability of 60% (the proportion of Azov currents in the Strait for a month) the oil spill would be floating to the Black Sea. Therefore, the probability of contamination of the shoreline of the Kerch Strait from Kerch to the exit from the Strait to the Black Sea (the Kyz-Aul Lighthouse) is the highest. The fuel oil patch would be transported into the Sea of Azov with the 35%probability affecting the coast of the Chushka Spit, and the position of the spill would be uncertain in 6% of cases (the proportion of mixed flows for the month).
In case of fuel oil surfacing, to assess the progressing of the Taman Bay contamination during spring and summer was much more difficult. Given the decrease in intensity of water exchange between the Bay and the open water areas of the Strait after the construction of the Tuzla dam, and the consequent change of water circulation mode to an anticyclonic type which intensified the accumulation process in the Bay, the probability of prolonged preservation of fuel oil contamination there was much higher.
4.5. Mathematical modeling of the oil spill accident spread on 11-16 November 2007
The information about the oil spilled and discharged into the sea jointly with its characteristics during the period of the Kerch accident was just partially available for the first mathematical simulations undertaken immediately after the event. Certain assumptions were made that during the storm, not only the oil from the broken-in-two Volgoneft-139 tanker entered into the sea, but the oil products as well spilled by the washed to the high bed boats were discharged into the water. While trying to take-off from the high bed after the storm, those boats could have discharged their ballast waters containing diesel oil jointly with the fuel from their bunkers. Finally, for the basis for calculations were taken the Ministry of Emergency Situations reports on discharge into the sea of 600 tons of oil from the Volgoneft-139 tanker bow during the period of 12 hours starting from 4:50 in the morning on 11 November. Three hours later oil started leaking from the stern of the boat that had run aground when approaching the Tuzla Island and the leakage went on for another 12 hours.
A reconstruction of the aforementioned Volgoneft-139 tanker accident looks as follows: Under a stormy South-South-Western wind impact, the oil slick hit the Tuzla Island’s Southern coast six hours after the accident had occurred. The oil got partially detained by the Tuzla Island to concentrate by its South-Western coast, while a part of spill started moving around the island from the South-West to proceed spreading through the Pavlov Insularity in the direction of the Chushka Spit and the Azov Sea (Fig. 4.5a).
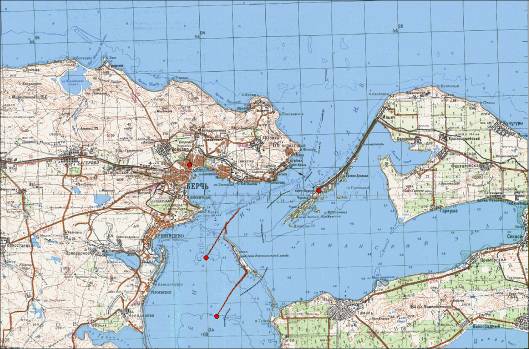
Fig. 4.5a. Oil spill six hours after the Volgoneft-139 tanker accident on 11 November 2007, 10:00 Moscow time, the 210° wind - 20 m/sec.
By mid-day on 11 November (12:00 Moscow time) the spreading oil reached the entrance to the Azov Sea and started spreading to the East to the Chushka Spit coast affected by the wind that had taken a South-Western direction (Fig. 4.5b).
The 240° wind prevailing during the day on 11 November had actually saved the Ukrainian Kerch Strait coast from pollution, while contributing to the oil slick arriving to the Western coast of the Chushka Spit and entering the Taman Bay. According to the simulated calculations, it happened 24 hours after the catastrophe had occurred (Fig. 4.5c). The still that happened afterwards to last for the whole night of 12-13 November worsened the ecological catastrophe at the Russian coast of the strait.
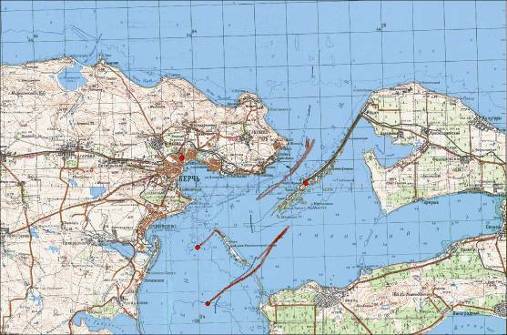
Fig. 4.5b. Oil spill 12 hours after the catastrophe on 11 November 2007, 16:00 Moscow time, the 240° wind -10 m/sec.
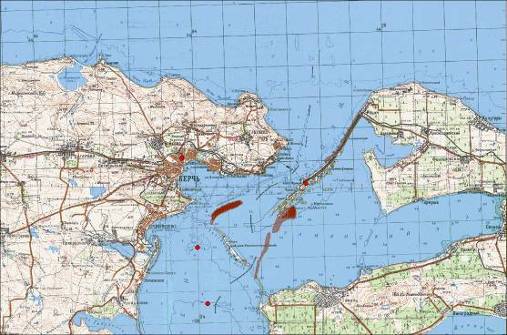
Fig. 4.5c. Oil spill 24 hours after the catastrophe on 12 November 2007, 4:00 Moscow time, a still wind.
In the afternoon on 12 November, the started South-Western wind (190-210°, 10-12 m/sec) tore-off the oil slick from the Chushka Spit coast and had almost brought it into the Azov Sea by 4 o’clock on 13 November (Fig. 4.5d). Still, starting from that moment its direction took a change to the South-West and by 9 o’clock on 13 November the oil slick having changed its direction into the opposite had hit the Taman Northern coast (Fig. 4.5e)
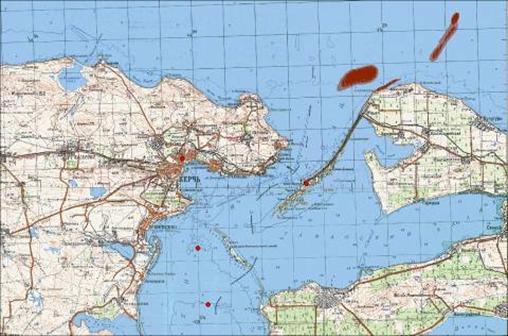
Fig. 4.5d. Oil spill 48 hours after the catastrophe on 13 November 2007, 4:00 Moscow time, the 310° wind - 5 m/sec.
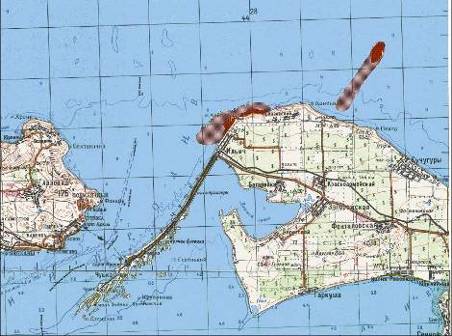
Fig. 4.5e. Oil spill 54 hours after the catastrophe on 13 November 2007, 9:00 Moscow time, the 320° wind - 5 m/sec.
In the afternoon on 13 November, the newly arrived still to practically last till the end of the day on 14 November, contributed to saving from oil pollution the Russian coast of the Azov Sea at the strait entrance. It was the Southern wind started on 15 November only that tore-off the oil slick from the shore to move it to the Azov Sea (Fig. 4.5f).
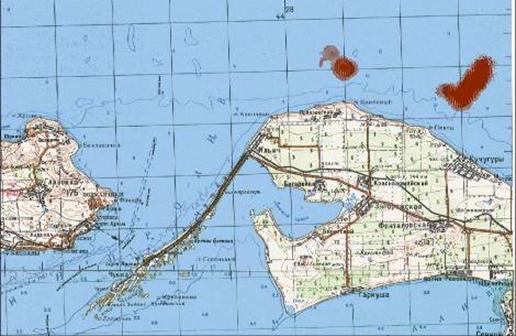
Fig. 4.5f. Oil spill 96 hours after the catastrophe on 15 November 2007, 3:00 Moscow time, the 100° wind - 3 m/sec.
The integrated picture of the Kerch Strait pollution during 11-15 November established based on the simulated model calculated results has shown the areas of the oil slick spread after the tanker accident (Fig. 4.5g). The oil was originally expected to spread largely by the sea surface. Nevertheless, the oil high density had to be taken into account due to which it could stay on the coast line elements, disperse in thick water and settle down to the strait bottom. All those mentioned had a potential to become a source of a long-term secondary pollution.
When comparing the figures with the helicopter monitoring surveys over the Kerch Strait oil pollution on 14 November 2007, one could recognize consistency present in the modeled calculations received and the actual data which built a trust to the simulated results. This was also confirmed by the Ukrainian ecologists reports who were the workers of the Ecology Department of the Kerch Technological University (a personal statement made by I.A.Kudrik, the Head and PhD in Medical Sciences). According to their provided data, the oil spills after the 11 November 2007 catastrophe was witnessed on the Tuzla Island Southern coast only. The oil spill did not reach the shore within the Kerch Inlet, at the Arshintsev Spit and Ukrainian coast of the strait at the entrance to the Azov Sea.
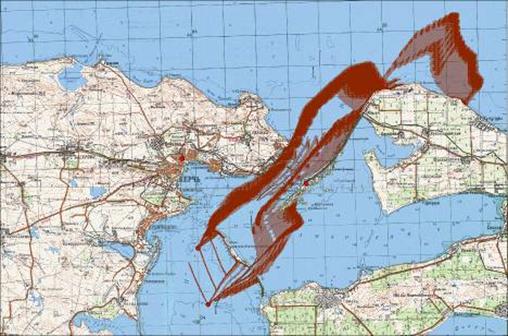
Fig. 4.5g. The Kerch Strait water space areas affected by the Volgoneft-139 tanker oil spill on 11-15 November 2007.
Similar results (Fig. 4.5h) were obtained by using a different type of mathematical hydrodynamic model (Ivanov K.A., Filippov Yu.G., 1978, Filippov Yu.G., 1997).

Fig. 4.5h. The calculated pathway of the oil spill from the first part of the tanker Volgoneft-139 over 48 hours after the catastrophe. Arrows show the currents in the Kerch Strait at 6:00 a.m. Moscow time, 13.11.2007.
Field studies conducted in spring-summer of 2008 during joint expeditions of various agencies in the area of the Volgoneft-139 tankershipwreck , allowed to confirm the preliminary assessments results speculating about the fuel oil spreading based on geographical and environmental analysis (Fashchuk D.Ya. 2008, 2008а) and mathematical simulations (Ovsienko S.N. et al., 2008). During the extreme storm under the influence of South-West wind, the Black Sea waters entered the Strait reaching the port of Caucasus and further. Salinity was 17.7‰ there (Matishov G.G. et al., 2008). Fuel oil has neutral buoyancy at this salinity. Part of it had been thrown out by the storm onto the beaches of Tuzla Island and Chushka Spit. The remaining in the water fuel oil was transported by flows into the Azov Sea and begun to settle onto the bottom because it was heavier than the water at its salinity of 12-13‰. After the storm calmed down, the restored Azov compensatory flow brought back the residual fuel oil from the Azov Sea into the Kerch Strait. The fuel oil, under the higher salinity there, emerged to the surface and was casted ashore on the Ukrainian coastline, at the Ak-Burun Cape and Arshintsev Spit, in particular.
Remnants of fuel oil, trapped on the bottom of the Strait in the area of the epicenter of the shipwreck (the Tuzla Spit and Tuzla Island) were moved outside of the area by the prevailing currents during the 2008 spring-summer. Practically, all the bottom of the Strait except for local areas in the far end of the Taman Bay, was void of consequences of the disaster by August, 2008.
The dark spots in the area of the Kerch Strait found on the satellite (SAR, synthetic aperture radar) images, produced at the time of the shipwreck and subsequent days, reflected most probably the films of light fractions of fuel oil (diesel) released from the tanks of the three other ships sunk in the Strait besides the Volgoneft-139 tanker. On top of this, background "fresh" films remained stable in this area due to the officially banned pumping of oil from small to large ships illegally taking place since 1990 in the Strait (Fashchuk D.Ya., et al., 2007). These “fresh” films break the spectrum of surface waves fixed by space radar images.
According to the Russian Ministry of Emergency Situations data, in the morning on 11 November 59 boats, out of which around 20 were the oil-carrier boats of the river-sea navigation type, were present in the vicinity of the Caucasus port. Approximately the same number of boats were anchored at the entrance of the Kerch Strait from the Black Sea with the Volgoneft-139 river-sea type tanker and the Volnogorsk, Kovel and Nahichevan dry cargo carriers being among them (Fig. 4.6a).
At 4.50 AM Moscow time on 11 November 2007 in the vicinity of an anchorage by the Southern side of the Tuzla Island the Volgoneft-139 tanker (Russia flagged ship owned by Bashvolgotanker, JSC, port of registry - Astrakhan, date of construction - 1978, ship crew - 13 persons, cargo on bord - - 4,077 tons of heavy fuel oil) broke-up in two, coordinates 45°15’0 N and 36°30’0 E, between anchorage areas Nos. 450 and 451) with its bow part remaining after the accident in place, while the stern started shifting in the direction of the Island of Tuzla affected by the wind and current. The other motor vessels being the Russian dry cargo ships of Volnogorsk (loaded with 2,437 t of granulated sulfur), Nahichevan (2,366 t of sulfur), and Kovel (1,923 t of sulfur) started drifting towards the coast of Ukraine (south of Tuzla Island), but sank. It was reported that the sulfur granulates leaked on to the sea floor. Due to the slow reaction in water, it was unlikely that granulates could lead to suspended colloidal sulfur in the short term.

Fig. 4.6a. Position of the boats in the Kerch Strait at the moment of the emergency situation arrival on 11 November 2007.
Based on the aforementioned scenario, one could assume that besides the oil discharged into the sea after the Volgoneft-139accident, the oil products from other boats washed aground were discharged as well. By general estimation, the oil products volume discharged into the strait water space could reach as much as 1,300-1,800 tons of heavy fuel oil out of 4,777 tons carried by the Volgoneft-139 tanker as a result of its breaking-up into two (Ovsienko S.N. et al., 2008).

Photo. Parts of the Volgoneft-139tanker: the grounded stern (a), towed to Port Caucasus on 15 November 2007, and the bow removed on 13 August 2008 (www.yuga.ru, Booklet, 2009).
The Kerch Strait storm lasted from the night till evening on 11 November. At 6 AM the Emergency Response Center started its operation in the premises of the Port Vehicle Traffic Monitoring System headed by A.V. Iovlev, the harbor master of the port of Caucasus. Already at 9 AM the Ukrainian Ministry of Emergency Situations diving speed-boat inspected the Tuzla Island coast and by 2 PM. it had finished inspecting the Strait water space in the sunken boats vicinity. According to the observation results, no visually floating oil slicks from the Volgoneft-139 tanker were detected. Separate oil pieces were witnessed at the sea surface covered with the light oil fractions veil (diesel fuel) that were coming into the sea from the bunker tanks of three other boats sunken in the Strait, i.e., the Volnogorsk, Kovel and Nahichevan dry cargo carriers.
By means of the Russian Ministry of Emergency Situations, at 9.30 AM - 12.30 PM. on 14 November 2007 a helicopter survey was carried out over the oil-polluted Strait jointly with mapping the oil slicks in the Strait water space and ashore (Table 4.6a, Fig. 4.6b).
Table 4.6a. Coordinates of the oil spill after the Volgoneft-139 accident on 11 November 2007 (based on the helicopter survey data).
| No | Coordinates | Items |
| Latitude-45°17’48 N Longitude-36°36’2 E | An oil-fuel slick | |
| Latitude -45°17’48 N Longitude -36°36’2 E | The Volgoneft-139 aft deck | |
| Latitude -45°15’56 N Longitude -36°30’8 E | An oil-fuel slick | |
| Latitude -45°15’8 N Longitude -36°30’3 E | Two slicks per 50 sq m, four slicks per 10 sq m | |
| Latitude -45°08’22 N Longitude -36°38’8 E | A one-piece oil-fuel slick around 200 sq m | |
| Latitude -45°12’65 N Longitude -36°32’043 E | Light fraction around 200 sq m | |
| Latitude -45°10’200 N Longitude -36°32’732 E | Tail’s start from the Volgoneft-139 nose part | |
| Latitude -45°11’800 N Longitude -36°32’500 E | Tail’s end Г shaped | |
| Latitude -45°11’44 N Longitude -36°32’50 E | An oil slick – tail | |
| Latitude -45°12’36 N Longitude -36°32’154 E | Slick’s edge from the Volgoneft-139 nose part | |
| Latitude -45°12’08 N Longitude -36°32’0 E | Two slicks: 1st – 200 sq m, 2nd – 400 sq m. | |
| Latitude -45°11’5 N Longitude -36°31’64 E | A slick, light fraction, 100 sq m | |
| Latitude -45°17’45 N Longitude -36°36’90 E | An oil-fuel slick of 60 sq m | |
| Latitude -45°22’0 N Longitude -36°43’1 E | Two large slicks at the shore | |
| Latitude -45°26’0 N Longitude -36°46’70 E | The edge point of coastal pollution | |
| Latitude -45°23’67 N Longitude -36°59’65 E | Tail’s start, light fractions | |
| Latitude -45°22’79 N Longitude -36°01’86 E | Tail’s end, 150-200 m wide, light fractions | |
| Latitude -45°26’29 N Longitude -36°53’80 E | Grass mixed with oil-fuel, area: 200 sq m | |
| Latitude -45°22’47N Longitude -36°43’48 E | Pollution of the coast line |
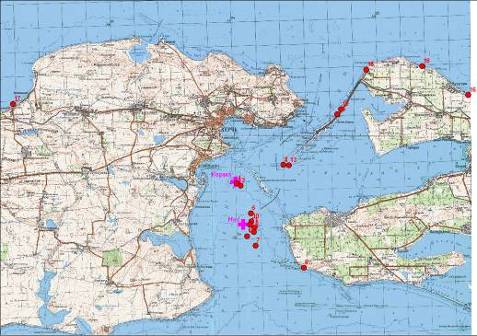
Fig. 4.6b. Results of a helicopter survey carried out by the Russian Ministry of Emergency Situations over the aftermath of the Volgoneft-139 tanker accident in the Kerch Strait on 14 November 2007 at 10:00 -12:00 in the morning. Numbers at the Figure correspond to the items in Table 4.6a.
Apparently, the source of the light oil products fractions tail registered from the entrance of the Kerch Strait (Azov Sea) along the Northern coast of the Kerch Peninsula was the dozens boats hit by the storm. The rest of the oil product slicks found in the sea had resulted from the Volgoneft-139 tanker accident. Attempts to prevent oil from leaking from the wreck, using booms, appeared to be unsuccessful due to the strong currents in the Strait.
The emergency actions after the storm in the water area of the Kerch Strait were undertaken by the personnel and with facilities of the Novorossiysk Department of Search and Rescue, and Diving Operations Management, the Port Authorities of the Port of Taman, the Taman Branch of the “Rosmorport“, and Black Sea Fleet.
On 13 November 2007 the fuel oil products transfer from the Volgoneft-123 to the Volgoneft-249 boats was completed, and in total 4,146 tons of M-40 heavy fuel oil were pumped over. On 15-17 November 2007, the salvage tug Svetlomor-3 was engaged in collecting oil products in the area of the pollution leakage around the bow part of Volgoneft-119. Approximately 43 tons of oil mixture and 1,200 kg of heavy fuel oil were gathered (in barrels on board). Svetlomor-3 together with the LB-57 speed-boat (Ukraine) collected oil products in the water area of other parts of the Kerch Strait as well under the guidance of the Kerch VTS Centre.
On 14November, in the vicinity of the Tuzla Spit, works were carried out to put 400-meter (two branches) booms between the spit and the Tuzla Island preventing further distribution of the oil. The oil film around was collected from the sea surface by specialized vessels.
On 15November, pumping out of heavy fuel oil from the Volgoneft-119 m/v was completed. Approximately 933 tons were pumped out.
On 16November, 886 tons of heavy fuel oil were pumped over from the bow section of the Volgoneft-139 tanker to the Volgoneft-119 tanker. From water area in position of the stern part of Volgoneft-139 by facilities and personnel of Novorossiysk Department of Search and Rescue and Diving Operations Management were collected about 50 m3 of heavy fuel oil and 200 m3 of oily water (Booklet, 2009). On 15 November 2007, the stern of the Volgoneft-139 m/v was brought afloat and towed to the port of Caucasus, then surrounded by booms.
On 18November, the sea-going Tornado tug and the Lamor technical supply vessel joined the clean-up operations in the water area of the Kerch Strait. The operations were directed by the Novorossiysk Office of Search and Rescue Diving Operations Management. In the period of 20-23 November the cleaning operations around the stern part of the Volgoneft-139 tanker continued. In total, 1,094 tons of heavy fuel oil was collected from the stern part of Volgoneft-139.
On 21Decembe,r the Vodolaz-2 diver cutter and the Lamor technical supply vessel made a diving inspection of the bow part of Volgoneft-139 with a view of its raising. The object conditions were the following: the bow part sat on a sandy bottom, practically on even keel. The depth over the object was 8.5 m. The forecastle deck of the bow part came out of the water. The cargo tanks were evaluated for the level of damage. All parts of equipment and systems on the main deck were found covered with a layer of heavy fuel oil. There were separate spots of heavy fuel oil on the forecastle deck. The scope of the preparatory work for recovery operations was estimated.
On 24 November 2007, organizational matters for recovering of the bow part of the Volgoneft-139 tanker were resolved with involvement of the Navy Fleet resources. Equipment, rigging, patches, tools and spare materials required for refloating operations were prepared. The project of the ship’s bow refloating was developed. On 25 November 2007, under stress of adverse weather and due to the storm warning notice the operations were suspended. On 2-3 December 2007, an attempt of refloating was made, but due to the weather conditions (storm) the work was suspended. On 9 December 2007, the diving investigation and preparation work for refloating and towing of the Volgoneft-139 bow were resumed. On 9-10 December 2007, mazut pumping from the tanks into the Mekhanik Razhev m/v (1,020 cubic meters of the oily water mixture) were carried out. On 22 May 2008, due to higher air temperature which consequently resulted in heating the heavy fuel oil still remained in the Voloneft-139 stern part, some heavy fuel oil spots started appearing on the water surface. Additional boom defense arrangements were provided on 20May 2008, and cleaning operation was conducted. Sorbent agents were used and the spilled oil products were collected on board the Impulse emergency response vessel.
Later, on 14 August 2008 the Volgoneft 139 tanker bow was recovered and towed to berth No 25 of the port of Caucasus. At present, it is being dismantled and recycled further.
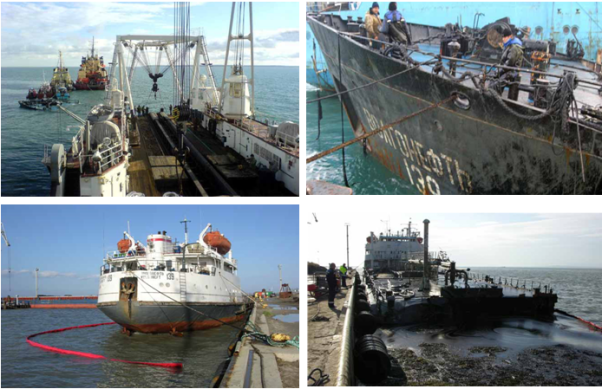
Photo. Raising operation of bow part and both bow and stern parts of Volgoneft-139 in the port Caucasus (Booklet, 2009).
Human resources (manpower) exceeding 2.5 thousand persons and more than 300 units of technical equipment were involved in the coastline clean-up operation. The specialized sub-divisions and rescue teams, EMERCOM and military sub-divisions, fire-fighting service were engaged in the process of eliminating the consequences. In addition, representatives of public and environmental protection organizations (see Chapter 6.3), cadets of Maritime Academy, students and other volunteers took an active part in cleaning shoreline operations.
By the end of November 2007, the volunteer workers from the Ministries of Emergency Situations, armed forces of Ukraine and Russia and many other organizations had completed collecting most of the oil at the beaches of the Crimean and Taman coast. In total, 7,140 tons of wastes were collected at that time on the Crimean coast (see Chapter 6.3 for more details). At the Russian coast, about 47,000 tons of oily wastes (oil- contaminated substrate and seaweeds) were collected on the beaches. Other source mentioned the slightly less volumes of oil-contaminated substrate collected from the coastline, i.e., about 40,000 tons (see Chapter 6.3). Thus, one could assume that nearly all oil products discharged into the sea by an accident arrived ashore and were later collected.
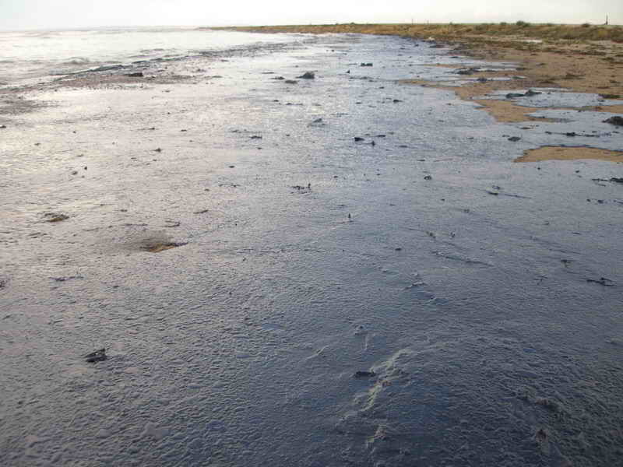
Photo: Oil spilled on the coast of the Tuzla Island, photo of Igor Golubenkov (NGO: Saving Taman), http://www.flickr.com/photos/.
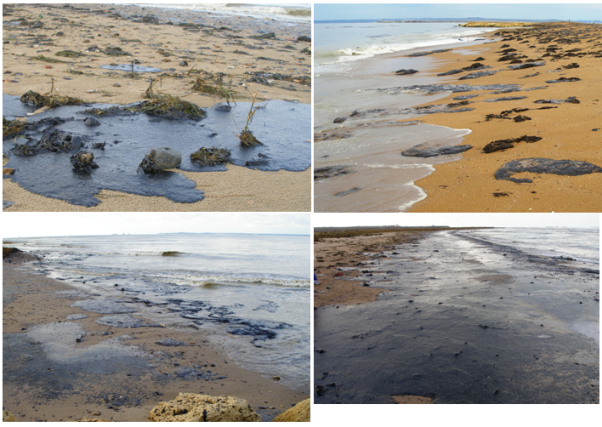 The
clean-up
operations on the coast that
continued for months are presented in detail in Chapter 6.3. Search and Rescue,
administrative actions after 12November 2007, post-disaster needs assessments,
responsibilities, oil spill preparedness and prevention lessons learnt are
presented in Chapter 9 and Annex 5.
The
clean-up
operations on the coast that
continued for months are presented in detail in Chapter 6.3. Search and Rescue,
administrative actions after 12November 2007, post-disaster needs assessments,
responsibilities, oil spill preparedness and prevention lessons learnt are
presented in Chapter 9 and Annex 5.
4.7. Consequences of the disaster
The consequences of the storm of 10-12 November 2007 were catastrophic. Since the Second World War there was no other case of such a mass and simultaneous wreck of ships. Four sulfur carrying boats (Volnogorsk, Nahichevan, Kovel, and Hach Ismail) sank in the Kerch Strait and near Sevastopol due to the stormy winds and the 5-meter waves. Six vessels (the Vera Voloshina, Ziya Koc, Captain Ismael ships, the Dika, Dimetra barges and the Sevastopolets-2 crane barge) were taken away from their anchors and ran aground at different sites at the Black Sea coast. Two tankers (Volgoneft-139 and Volgoneft-123) and the BT-3754 barge suffered damage. Four people died and four went missing, about 6,726 tons of technical sulfur carried by the damaged vessels got discharged into the sea.
The Volgoneft-139 tanker broke apart at its anchorage No 451 to the South from the Tuzla Island at 4:50 AM Moscow Time on 11 November 2007 causing leakage of heavy oil into the sea. Tanker’s bow retained its position while the stern began drifting towards the Tuzla Island. The tanker had carried a total of 4,777 tons of heavy oil, about 1,300 out of which leaked into the sea. A strong wind and the waves contributed to spreading the oil products over the Strait resulting in the coastline heavy pollution.
Shipwrecks occurred as well in other places of the Russian Black Sea coast since some Georgian and Turkish ships and small boats were washed ashore in Kabardinka and Gelendzhik.
The storm brought about big changes to the coast and bottom of the submerged continental slope. For example, the coastal cliff between the Capes of Iron Horn and Panagya shifted inland by 2-3 m (by 5-7 m in some places) and some deep Earth slips happened.
Separate parts of the bay coastal fulls rose by 0.1-0.3 between Gelendzhik and Tuapse, certain river mouths were partially blocked by the pebble bars and several coast line facilities got damaged. Divers discovered vertical direction modifications of the local sand bottom reaching 0.2-0.3 m near the outskirts of the ridge bench at the depth of 8-11 m. Those bottom modifications were determined by the enhanced sediments shifting within the submerged accumulative ridge and depression terrain limits.
The storm has strongly affected the Imeretin Lowlands coast near the Cape of Konstantinovsky close to the town Adler. There, a cliff shifted 40-50 m inland, a former wave-breaker remnants were washed away and the waves went by 120-170 m inside the lowlands. By means of a scuba-diving survey were discovered the nearly 50-60 m submerged-canyon talweg cut-in into the continental slope and numerous slides on the submerged canyon sides.
A serious damage was inflicted on the coast protecting constructions, recreation beaches and the sea-front embankments, as well as their auxiliary facilities and small sale outlets that were often within the wave-affected zone.
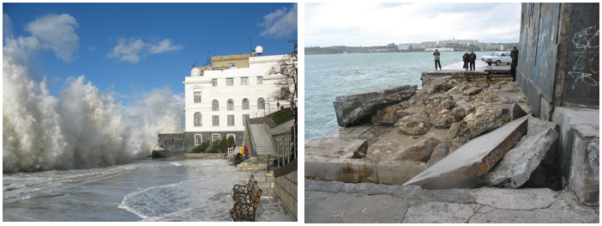
Photo: The storm on 11th of November 2007, Sevastopol, building of IBSS, and it’s consequences on the next day. Photo by Sergey Alyomov.
Chapter 5. Standard Hydrochemistry
Agapov S., Korpakova I., Aleksandrova Z, Romova M, Baskakova T., Matishov G., Berdnikov S., Savitsky R., Komorin V., Orlova I., Pavlenko N., Denga Yu., Ivanov D., Ilyin Yu., Malchenko Yu., Shibaeva S., Djakov N., Chasovnikov V., Nasurov A., Ermakov V., Petrenko O., Trotsenko B., Zhugailo S., Sebakh L.
5.1. Background and baseline conditions observed in 1981-2007
5.2. Observations conducted in 2007-2009 to study the effects of the Kerch accident
5.2.1. ChAD (Russia): Expeditions in July, August, November and December 2008
5.2.2. Opasnoe HMS (Ukraine): routine monitoring in 2008-2009
5.2.3. AzNIIRKH (Russia): November 2007, April-October 2008
5.2.4. SSC RAS (Russia) November-December 2007
5.2.5. UkrSCES (Ukriane): July and December 2009
5.2.6. MHI (Ukriane): December 2009 Kerch Strait near Tuzla Island
5.2.7. YugNIRO (Ukraine): November 2007-March 2009
5.2.8. Nutrients exchange between the Black and Azov Seas in 2008-2009
5.2.9. Summary: Standard hydrochemical parameters
5.1. Background and baseline conditions observed in 1981-2007
In the former Soviet Union, standard hydrochemistry and pollution level investiga¬tions in the waters of the Kerch Strait were carried out regularly in the period 1981¬1992 in the framework of the state monitoring of marine waters by the HMS «Opas- noe», situated in the vicinity of the city of Kerch. Since 1992 the monitoring has been sustained by Ukraine in the framework of its Hydrometeorological Service (the same HMS «Opasnoe»). The program covers determination of concentrations of dissolved oxygen (O2), pH, alkalinity (Alk), phosphates (P-PO4) and total phosphorus (Ptotal), silicates (Si), nitrites (N-NO2), nitrates (N-NO3), ammonia (N-NH4), and a number of pollutants such as total petroleum hydrocarbons (TPHs), detergents (Det) and phe¬nols (Phen). The quantity of measurements performed per environmental parameter in 1981-2007 is presented in Table 5.1a.
Table 5.1a. The number of measurements of standard hydrochemical parameters and some pollutants at transect between ports Crimea and Caucasus in 1981-2007.
| Year | °2 | Ph | Alk | PO4 | Si | NO2 | NO3 | NH4 | TPHs | Det | Phen | |
| 1981 | 251 | 213 | 190 | 171 | 12 | 169 | 1721 | - | - | 150 | 137 | - |
| 1982 | 133 | 114 | 133 | 133 | - | 133 | 133 | - | - | 24 | 64 | - |
| 1983 | 295 | 196 | 190 | 183 | - | 171 | 172 | 34 | - | 42 | 91 | - |
| 1984 | 239 | 229 | 124 | 122 | - | 122 | 122 | 98 | - | 137 | 96 | - |
| 1985 | 178 | 120 | 83 | 83 | - | 83 | 83 | 83 | - | 125 | 82 | - |
| 1986 | 260 | 260 | 70 | 70 | 70 | 70 | 70 | 70 | - | 28 | 56 | - |
| 1987 | 52 | 52 | 52 | 43 | 43 | 43 | 36 | 36 | - | - | - | 40 |
| 1989 | 410 | 423 | 60 | 60 | 60 | 60 | 60 | 60 | 60 | 71 | 8 | 58 |
| 1992 | 250 | 250 | 96 | 96 | 96 | 96 | 96 | 96 | 96 | 126 | 92 | 94 |
| 1994 | 48 | 48 | 48 | 48 | 48 | 48 | 48 | 48 | 48 | 48 | 48 | 48 |
| 1995 | 24 | 24 | 24 | 24 | 24 | 24 | 24 | 24 | 24 | 24 | 24 | 24 |
| 1997 | 60 | 60 | 60 | 60 | 60 | 60 | 60 | 60 | 60 | 60 | 60 | 60 |
| 1998 | 48 | 48 | 48 | 48 | 48 | 48 | 48 | 48 | 48 | 48 | 48 | 48 |
| 1999 | 48 | 48 | 48 | 48 | 48 | 48 | 48 | 48 | 48 | 48 | 48 | 48 |
| 2000 | 56 | 56 | 56 | 56 | 56 | 56 | 56 | 56 | 56 | 56 | 56 | 56 |
| 2001 | 48 | 48 | 48 | 48 | 48 | 48 | 48 | 48 | 48 | 48 | 48 | 48 |
| 2002 | 104 | 104 | 104 | 104 | 104 | 104 | 104 | 104 | 104 | 104 | 104 | 104 |
| 2003 | 192 | 192 | 192 | 192 | 192 | 192 | 192 | 192 | 192 | 168 | 176 | 184 |
| 2004 | 279 | 279 | 279 | 279 | 279 | 279 | 279 | 279 | 279 | 168 | 232 | 216 |
| 2005 | 200 | 200 | 200 | 200 | 200 | 200 | 200 | 200 | 200 | 200 | 200 | 200 |
| 2006 | 200 | 200 | 200 | 200 | 200 | 200 | 200 | 200 | 200 | 200 | 200 | 200 |
| 2007 | 200 | 200 | 200 | 200 | 200 | 200 | 200 | 200 | 200 | 200 | 200 | 200 |
| Total | 3575 | 3364 | 2505 | 2468 | 1788 | 2454 | 2450 | 1984 | 1663 | 2075 | 2070 | 1628 |
Detergents. Since 1981, during all periods of monitoring the waters of the Kerch Strait were rather clean from detergents. Meanwhile, spring and autumn were the seasons of a visible increase in the detergents content in the area (Fig. 5.1a). The maximum observed was 8.4 MAC (840 pg/l) in May 1983.
Phenols. The mean concentrations of phenols observed were generally less than 3 pg/l, with isolated cases of high phenols content in the waters of the narrowest place of the Kerch Strait. A very high level of 20 MAC (20 pg/l) was recorded in Decem¬ber 1990.
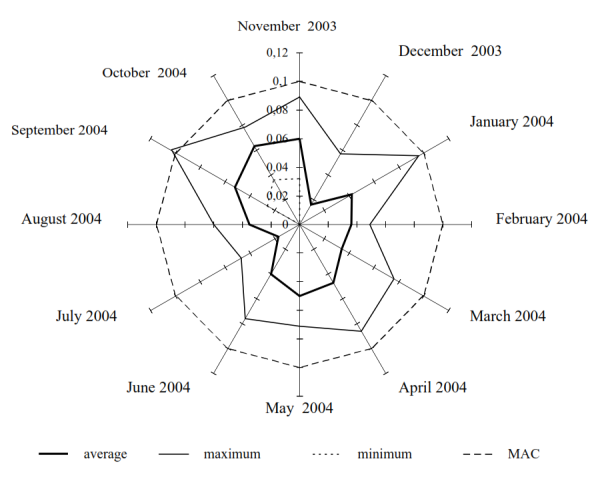
Fig. 5.1a. Seasonal distribution of detergents (mg / l) in the Kerch Strait waters in 2003–2004.
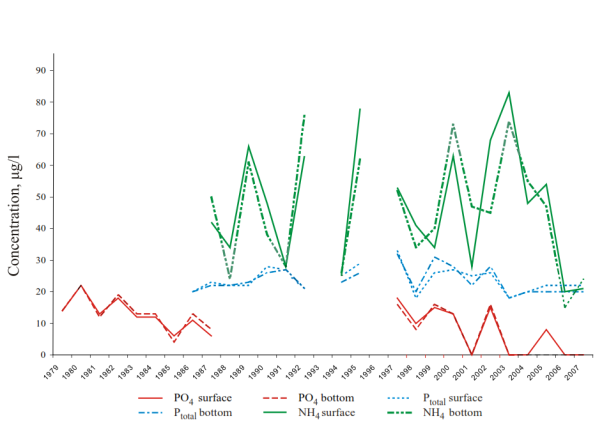
Fig. 5.1b. Nutrients annual dynamics in the Kerch Strait waters in 1979–2007.

Fig. 5.1c. Approximation of the total nitrogen concentration dynamics in the Kerch Strait waters In 2000–2007.
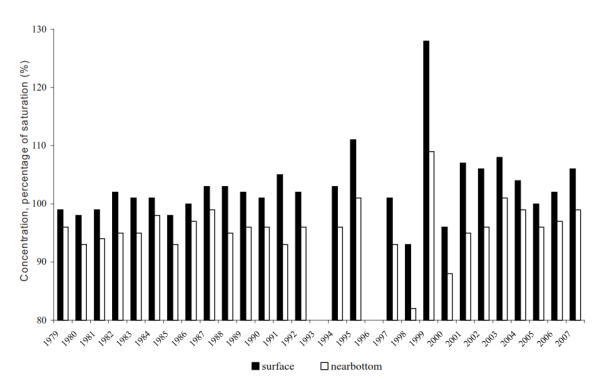
Fig. 5.1d. Average dissolved oxygen concentration ( % of saturation) in surface (black) and bottom waters (white) of the Kerch Strait in 1979– 2007.
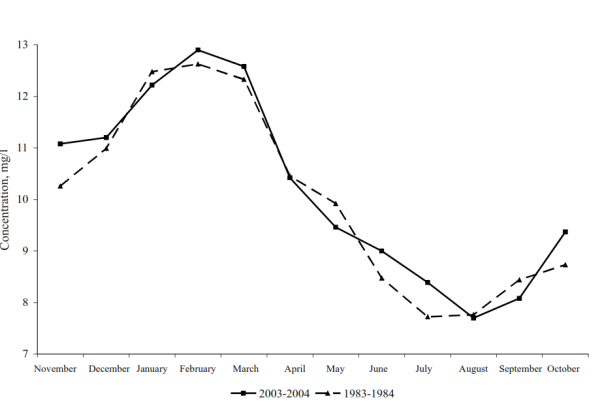
Fig. 5.1e. Seasonal variability of oxygen concentrations (mg / l) in the Kerch Strait waters in 1983–1984 and 2003–2004.
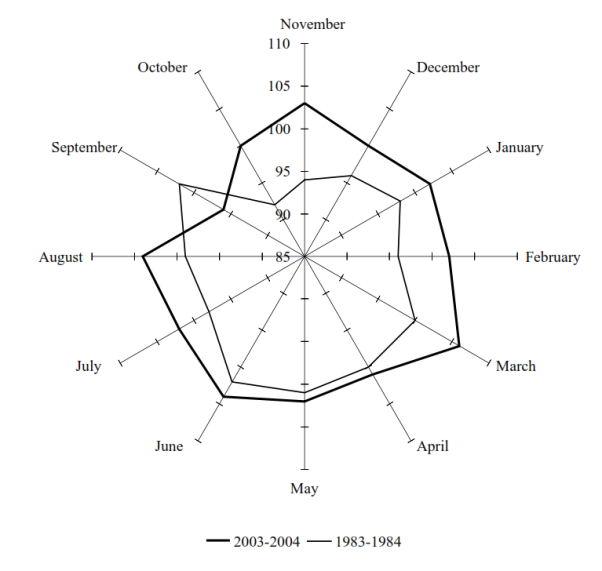
Fig. 5.1f. Seasonal distribution of oxygen saturation (%) in 1983–1984 and 2003–2004.
Nutrients. Average annual concentrations of phosphates exceeded the level of detection limit DL (10 µg / l) in the first half of 1980s and at the end of 1990s only. The maximum reached was 76 µg / l in 1980. The maximum total phosphorus content was recorded in bottom waters in September 2003 — 160 µg / l, a value which is half the ecological norm of 300 µg / l 2 (Fig. 5.1b). The mean concentrations of ammonia never exceeded the MAC of 390 µg / l and the maximum in surface waters was 950 µg / l in March 2004. Nitrites content usual ly was below the DL of 5 µg / l, however, in June 2007 it reached 47 µg / l (2.4 MAC) in the surface layer. The total nitrogen concentration varied from 37 µg / l in April 2004 to 2840 µg / l in July 2000. For the period of 2000–2007 this parameter showed a strong inter-annual variability (Fig. 5.1c) with an increasing tendency since 2002.
Oxygen. Over the whole period of monitoring the waters in the Kerch Strait were well aerated at surface as well as in the near bottom layers (Fig. 5.1d). Only in a sin gle case, in June 1991, in the narrowest part of the Strait the oxygen in the near bottom layer dropped down to 2.96 mg / l (39 % of saturation). Seasonally high oxygen concentrations were observed during winters and they were decreasing closer to summer as examples of the 1983–1984 and 2003–2004 periods demonstrate (Fig. 5.1e, f).
IWP. The complex Index of Water Pollution (see Chapter 7 for description of the index), calculated for the concentrations of three priority pollutants of the Kerch Strait area (pe troleum hydrocarbons, detergents, ammonia) and oxygen content evidenced good water quality in the period 2003–2006, however, shortly before the Kerch accident the waters were classified as ‘moderately polluted’ (Tab. 5.1b).
Table 5.1b. The concentration of main pollutants and level of IWP in the Kerch Strait waters in 20032007.
| Parameter | Mean concentration in MAC | ||||
| 2003 | 2004 | 2005 | 2006 | April-October 2007 | |
| TPHs | 1.6 | 1.6 | 1.2 | 1.2 | 2.0 |
| Detergents | 0.43 | 0.47 | 0.62 | 0.37 | 0.48 |
| Ammonia | 0.21 | 0.11 | 0.14 | 0.04 | 0.06 |
| Oxygen | 0.70 | 0.67 | 0.72 | 0.69 | 0.72 |
| IWP | 0.74 | 0.71 | 0.67 | 0.68 | 0.82 |
| Class | II | II | II | II | III |
| Water quality | clean | clean | clean | clean | moderately polluted |
5.2. Observations conducted in 2007-2009 to study the effect of the Kerch accident
Six major Russian and Ukrainian Scientific Research Institutes got involved in the investigations on the Kerch accident effects in 2008-2009 in terms of hydrochemi- cal regime change: the SB SIO RAS, AzNIIRKH, SSC RAS, MHI, MB UHMI and UkrSCES. Regular observations in the Kerch Strait continued also in the frames of the Ukrainian National Monitoring Program (HMS Opasnoe). All observations organized in the Kerch area in 2008-2009 are described further.
5.2.1. ChAD (Russia): Expeditions in July, August, November and De-cember 2008
In 2008 four cruises were carried out in July-August, November, and December by the Black-Azov Seas Directorate of Rosprirodnadzor (ChAD, Novorossiysk). The aim of these complex investigations was to assess the state of the marine environment in the Kerch Strait, Black and Azov Seas, and especially at the places of shipwrecks of the Kerch accident. Data on dissolved gases, concentrations and distribution of inorganic nutrients and organic matter in water and sediments, contamination by pe¬troleum hydrocarbons and sulfur, and other environment parameters were collected during the expeditions at 77 stations (Table 5.2.1a, Fig. 5.2.1a). Laboratory and ana¬lytical work was conducted at the SB SIO RAS in Gelendzhik. Samples collection, processing, and analysis were performed using standard oceanographic methods (Oradovsky S. G., 1993, Bordovsky O. K., Chernjakova A. M., 1992).
Table 5.2.1a. Hydrochemical parameters of water and bottom sediments investigated by ChAD in the ar¬ea of the Kerch Strait during July-December 2008.
| N | Measured parameters | Number of Samples | |
| Water | Bottom Sediments | ||
| 1 | Salinity | 92 | - |
| 2 | PH | 377 | - |
| 3 | Suspended matter | 155 | - |
Salinity. The distribution of salinity in the Kerch Strait is defined by the interaction between saline waters of the Black Sea and less saline waters of the Azov Sea. As a result, salinity decreases in the Strait from the South to the North (Fig. 5.2.1b). Salinity variability is very high and depends on the hydro-meteorological condi¬tions in the Strait. In 2008 salinity varied in the range of 6.56-18.17 PSU. The av¬erage salinity was 15.01 PSU well corresponding to the long-term values known for the area (see Sub-chapter 3.5).
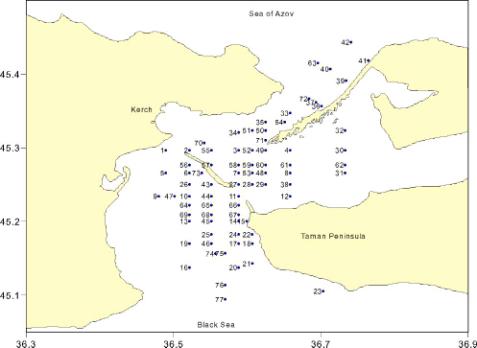
. 5.2.1a. Location of stations in the Kerch Strait during July-December 2008.
Oxygen. Oxygen content varied from 5.79 mg/l to 12.11 mg/l (Fig. 5.2.1c) during the observation period, the average was 8.2 mg/l. The maximum oxygen saturation was 150 %, the average — 109 %, at some stations oxygen deficiency was observed. Mainly, it was due to predomination of decomposition over production because of an active decay of organic matter and respiration of organisms, and well related with the level of eutrophication/pollution in the areas of concern. For instance, in August 2008 the values around of Minimum Allowed Concentration (1 MinAC equal 6.0 mg/l, MAC List, 1999) were observed in bottom layers near the Panagia and Enikale Capes, 5.79 mg/l and 6.03 mg/l respectively, evidencing lower water quality. Hence, high concentrations of nitrate nitrogen and oil products were observed in water and bottom sediments at these two stations. Normal background concentrations, fluctuating around the average of 118 % of oxygen saturation, were observed at the rest of the studied stations in August.
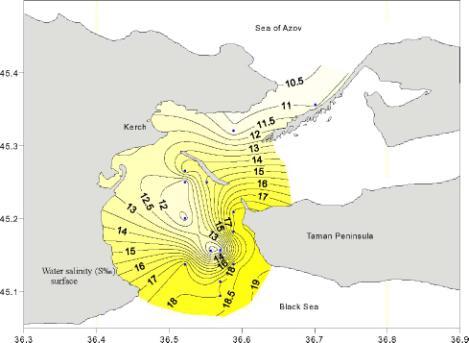
Fig. 5.2.1b. Water salinity (S%o) in the surface layer in December 2008.
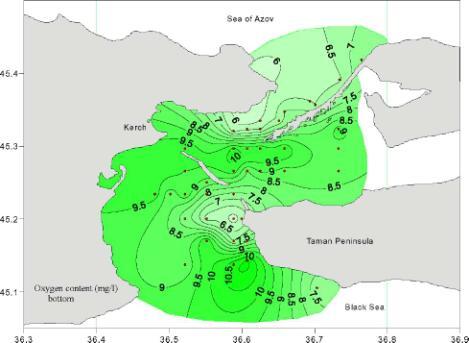
Fig. 5.2.1c. Oxygen content (mg/l) in bottom layers observed on 31 August, 2008.
There were no anomalies of oxygen content observed in November 2008. The oxygen concentration varied from minimum of 9.06 mg/l to maximum of 11.46 mg/l and the saturation varied from 99 % to 125 %. In December the minimum oxygen concentration of 9.72 mg/l was observed again near the Panagia Cape. In general, the oxygen content increased simultaneously with temperature decreasing during the observation period. The average content was 10.12 mg/l in November and 11.17 mg/l in December. However, the oxygen saturation decreased slightly to the averages of 107 % in autumn and 98.3 % in winter due to less intensive photosynthetic activity.
pH. This parameter varied from 6.66 to 9.05. Its maximum was observed in surface waters in summer time. The average value was 8.42. Low pH values were observed at the Panagia Cape and the Caucasus Port during the autumn expedition. As the norm for pH established from 6.5 to 8.5, the maximum observed pH values in the Kerch Strait were slightly over it in 2008 (1.06 of MAC for the maximum pH recorded), (MAC List, 1999). These high pH values were well related to the high water temperature and active photosynthesis processes, and they are natural during summers for this areas though exceeding established MAC.
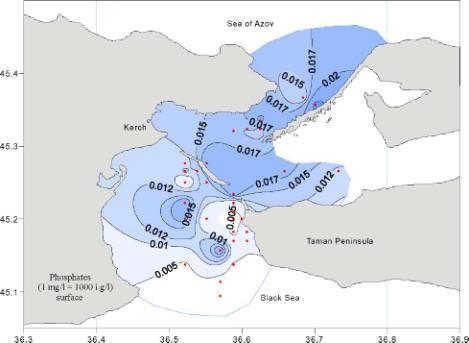
Fig. 5.2.1d. Phosphates concentration (mg/l) on the surface in December 2008.
Phosphates (P-P04). Phosphates content varied from 1 ^g/l to 70 ^g/l at the area observed. The values did not exceed MAC (150 ^g/l). The average content was 8 ^g/l. Maximal concentrations of phosphates were mostly discovered at the stations in the Northern part of the Strait, between the Enikale Cape and the Chushka Spit (Fig. 5.2.1d).
The highest content of inorganic phosphorus was identified during winter time, when the average value was 12 pg/l. Maximum and average concentrations were two-fold higher in the Kerch Strait compared to the North-Eastern part of the Black Sea (Si- monov A. I., Altman E. N., 1991).
Nitrites nitrogen (N-NO2). In the summer cruises, nitrites were discovered in the Northern part of the Strait only, similarly to phosphates, between the Crimea and the Chushka Spit. This water area should be categorized as the most polluted. Nitrites appeared in other areas during autumn and winter, increasing in time. The concentrations in water varied from analytical zero to 15 pg/l. The average content was 1.6 pg/l. Vertically the content was higher in bottom layers. The values of nitrites were lower than the MAC for fisheries (80 pg/l) during the whole observation period.
Nitrates nitrogen (N-NO3). Nitrates nitrogen content varied from 2 pg/l to 434 pg/l. The average value for July-December was 30 pg/l. In August, November, and December the averages were 14 pg/l, 24 pg/l and 56 pg/l correspondingly. The nitrates were substantially exceeding the background concentrations in November 2008 only. Maximal values were found at the Chushka Spit, Tuzla Island, and also around the Taman Peninsula. The nitrates content was increasing from summer to winter. The concentrations of nitrates were significantly higher in the Kerch Strait compared to the Black Sea.
Ammonium nitrogen (N-NH4). The high content of ammonium nitrogen was the distinguishing feature for the studied area during the whole period of observations. Maximal values were recorded at the stations close to the Panagia Cape, Tuzla Island and Chushka Spit. The ammonia varied from 8 pg/l to 180 pg/l, with the average of 58 pg/l. The values were 4.4 times higher than those observed in the area of the Novorossiysk Port in 2008. The ammonia content can fluctuate significantly due to pollutions and processes related to biochemical decomposition of organic substances. Vertically, the content observed in surface layers was higher than nearby sea bottom. In time maximal values were observed in winter in parallel with increase in organic substances in water. Ammonia content did not exceed the MAC for fishery (2900 pg/l) in the studied area.
Silica acid (Si-SiO2). Silica acid content varied from 1 pg/l to 1242 pg/l, with an average of 256 pg/l. MAC of Silica acid for fisheries is 1000 pg/l. The concentration of silicates at 3 stations was higher than norm and the maximum was 1.2 of MAC. The observed patch appeared due to water inflow from the Azov Sea enriched with dissolved silicon.
Suspended matters. The quantity of suspended matter varied from the level of detection limit of 1.0 mg/l to 399 mg/l. The average concentration of suspended solids was 31.6 mg/l (Fig. 5.2.1e). In general the content of SS was high in the whole water column in the Kerch Strait during the survey periods.
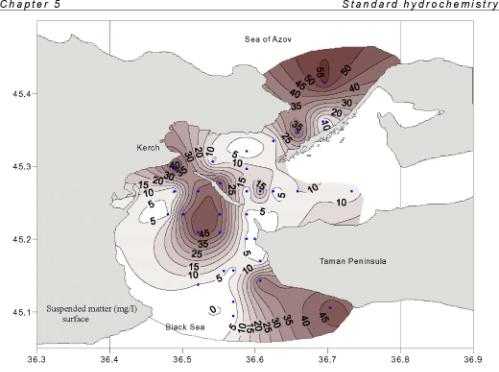
Fig. 5.2.1. Content of suspended matter (mg/l) in the surface layer of the Kerch Strait in November 2008.
In adjacent Black Sea coastal waters the average concentration of suspended matter varied from 4 mg/l to 6 mg/l, which was several times lower than the regularly observed values in the area of the Strait. As a rule, maximum content in the water column is observed in the Southern and Northern parts of the Strait and nearby the Tuzla Island. During the 2008 summer and autumn surveys the average content of suspended matter was of 21.0 mg/l. It doubled almost twice (up to 47.5 mg/l) in winter. Usually, the suspended matter content is higher in the bottom layer. The major sources of suspended solids are the river flows, precipitation, and atmospheric deposition. In addition, turbulence during storms and intensive navigation increases the input of suspended matter from sediments to the shallow waters of the Kerch Strait.
Conclusions on the ChAD expeditions in 2008
The hydrochemical parameters of the shallow waters in the Kerch Strait significantly differ in values from those of the adjacent areas of the Black Sea. This difference is reflected, as a rule, in a higher content of nutrients and pollution, especially for areas close to the shoreline. Actually, the whole Kerch Strait is under a strong anthropogenic pressure, well reflected in persistently observed abnormal values of environment parameters.
The 2008 surveys in the Kerch Strait provided up-to-date information on the content and distribution of major hydrochemical parameters. The waters in the Strait were well saturated with oxygen; no hypoxic or anoxic situations were registered. However, there were areas with relatively low content of oxygen in bottom layers, and over-saturation at surface indicating active photosynthesis, hence high concentrations of nutrients and organic matter in the water. True, nutrients, suspended matter and pollutants in the Kerch Strait are higher than in the North-Eastern part of the Black Sea, and even higher than in the Gelendzhik and Cemes Bays which are characterized by limited water exchange and heavy anthropogenic impact. The most impacted areas in the Kerch Strait are situated between the Chushka Spit and Crimea shoreline, the section of the Taman Peninsula between the Panagia and Tuzla Capes, and the water area at the South side of the Tuzla Island. Despite of the high variability of hydrochemicals distribution in the Strait related to the complicated dynamics of water flows here, the high baseline concentrations of nutrients are quite stable in these waters and well related to external land-based or ship-borne sources. However, nutrients in 2008 were lower than MACs for fisheries. As per today, the hydrochemical regime of the Kerch Strait corresponds to the established standards of the Russian Federation. However, these standards (especially for nutrients) need serious revision, as they indicate values which are more suitable for fresh waters, and if observed in marine environment might cause serious disturbance to biota.
5.2.2. Opasnoe HMS (Ukraine): routine monitoring in 2008-2009
In the frames of the routine Ukrainian national monitoring of marine waters standard hydrochemical parameters were studied in the Northern narrow pass of the Kerch Strait at a transect between the ports of Crimea and Caucasus (Fig. 2c). The investigations were carried out from April to November 2008 and from April to June 2009 by the Opasnoe HMS during 35 field expeditions. Concentrations of dissolved oxygen, hydrogen ion (pH), general alkalinity, phosphates and total phosphorus, silicates, nitrites, nitrates ammonia and total nitrogen, detergents, phenols and petroleum hydrocarbons were measured in 280 samples. The total petroleum hydrocarbons distribution is discussed in Chapter 6.
Detergents. In 2008 their concentrations varied from zero to 130 pg/l in surface waters with the average value of 38 µg/l, and from 0 to 83 µg/l in the near-bottom layer with a mean less than the detection limit of 25 µg/l. The maximum reached 1.3 MAC and was recorded at the Light Cape in September. In 4 samples only the detergents were above 1 MAC. In the first half of 2009, in eight samples only the concentrations were above the detection limit.
Phenols. In 2008 the range of phenols concentration was 0-3 µg/l. Elevated level was observed over the whole studied period. The monthly average concentration was similar to previous data collected in 2007. In the first half of 2009 phenols occasionally reached 4 µg/l in April and June, otherwise the mean value was less than 3 pg/l.
Nitrogen. Nitrites nitrogen (N-NO2) was rarely found in May-October 2008, with concentrations changing within the range from below the detection limit of 5 pg/l to the maximum of 16 pg/l (surface waters in September 2008). Nitrates (N-NO3) reached the level of 53 pg/l on 26 May in surface waters near the Crimea shore. Periodically in April-July, their concentration was below the detection limit of 10 pg/l. Ammonia was presented in the Strait waters permanently in the range of 0-104 pg/l. Its maximum was detected on 4 June 2008 near Crimea. The total nitrogen concentration varied between 130 and 980 pg/l, and its mean in the surface layer was 530 pg/l, whereas in near-bottom waters — 500 pg/l. In 2008, the Russian ecological norm of 500 pg/l was exceeded occasionally in April-July (e. g. on 23 April, 14 May, 4 June, 17 July), and frequently in August, September and October. In April-June 2009 the mean ammonia concentration was lower — 13 pg/l (compared to the average of 17 pg/l observed in April-June 2008). For total nitrogen the decrease was about 1.5 times, while for nitrites and nitrates remained in 2009 the same as 2008.
Phosphorus. In 2008 the concentration of inorganic phosphorus (P-PO4) reached its maximum of 25 pg/l on 30 October in the surface layer and was below the detection limit (DL) of 10 pg/l in most cases observed within the warm period of the year from May to November. Monthly mean value exceeded DL only in September — 14 pg/l. The total phosphorus maximum was 42 pg/l, the averages were 24 pg/l and 22 pg/l in surface and bottom layers correspondingly. All values observed were significantly lower than the ecological norm of 300 ^g/l. In 2009, the distribution and level of phosphorus remained unchanged compared to 2008.
Silicates. In 2008 the silicates concentration varied in the range of 10-1250 ^g/l. The maximum was recorded on 24 September in surface waters. The mean value for similar seasons was 180 ^g/l, and it slightly increased in 2009 to 220 ^g/l.
Oxygen. The waters of the Kerch Strait were well aerated in 2008-2009. The oxygen saturation varied from 79 % to 121 % and the mean value was 90 %. In all samples the oxygen content exceeded the ecological norm of 6 mg/l (set for the warm period of the year).
pH. In 2008 pH varied in the range of 7.31-8.60. The mean values for surface (8.42) and deep waters (8.38) were very close. In 2009 µH slightly decreased to 8.28 in both layers.
Index of Water Pollution (IWP). The Kerch Strait Index of Water Pollution based on the annual mean concentrations of petroleum hydrocarbons, detergents, ammonia and oxygen was calculated for 2008 at the level of 0.39, which allowed to qualify the waters in the strait as «Clean». In 2009 the IWP slightly increased to 0.52, however, the water quality class remained the same — «Clean» (see Sub-chapter 7.6 for details on IWP).
Conclusions on the UA monitoring
The UA monitoring data collected at a transect between the ports of Crimea and Caucasus show, in general, low level of nutrients and pollutants present in 2008 and first half of 2009. The mean concentrations of all measured parameters were lower than 1 MAC except for the total nitrogen. In 2008, the detergents content in the water decreased by up to 2.7 times compared to 2007, while the phenols level remained unchanged. The 2008 concentrations of total nitrogen and silicates were also lower than in 2007, and there was no significant change for other species of nutrients. The oxygen regime was rather good and had a negligible variation in both layers. The worse water quality according to measured concentrations was in the area close to the port of Crimea. According to the Index of Water Pollution, in 2008 the water of the Kerch Strait became less polluted and could be qualified as «clean» (IWP=0.39). In 2007 (IWP=0.82) it was classified as moderately polluted, as mentioned in Subchapter 5.1. In 2009, the waters were still «clean» even IWP slightly increased to 0.52.
5.2.3. AzNIIRKH (Russia): November 2007, April-October 2008
Expedition of AzNIIRKH to the Southern part of the Azov Sea was undertaken from 30 November to 3 December and to the Black Sea — from 6 to 7 December 2007. There were 12 radial cross sections with the center at the shipwreck of the Volgoneft- 139 tanker studied. The objectives of the studies in the Kerch Strait and in the Azov and the Black Seas were to identify: (i) boundaries in water and sediments of the spots polluted by oil and sulfur, and (ii) impact assessment on communities of aquatic organisms and environment, in general. Hydrological (salinity, flow velocity and directions, water temperature, waves, turbidity, and depth), standard hydrochemical and geological investigations were carried out in parallel. The following hydrochemical parameters were observed: dissolved oxygen, BODj mineral and total phosphorus, ammonia, nitrites, nitrates, total nitrogen, silicates, dissolved matter and suspended solids, sulphates in the place as well as geochemical parameters (granulometry, pH, Eh, organic carbon and sulphates in the water).
Investigations on pollution included TPHs, PAHs and aliphatic hydrocarbons (C14-C23) in water and sediments. Studies on biota consisted of TPHs and PAHs in moluscs measurements, microbiological, hydrobiological and toxicological researches. Floating oil films, areas of high turbidity, foam and etc. were fixed visually with photo and video equipment. The size and location (coordinates) of the oil films were identified. The study area was limited to the range of the pollution after the Kerch shipwreck. The distance between stations was 10 miles (Fig. 5.2.3a). Water samples were collected at 3 to 5 layers depending on the depth of the area studied.
The highest concentrations of inorganic and organic nutrients were recorded in the North-Eastern part in the Taman Bay and South-West of the Kerch Strait. For the Taman Bay, the usual concentrations of ammonia was 110 pg/l, nitrites — 15 pg/l, nitrates — 65 pg/l, phosphates up to 35 pg/l (Fig. 5.2.3b-e). In the Kerch Strait nitrates were about 20-30 pg/l, phosphates 35-40 pg/l. Further, extreme concentrations of nutrients, such as the observed 260 pg/l of ammonia or 20 pg/l of nitrites were rare in the Strait (Fig. 5.2.3b, c).
The spatial distribution ofNorg resembled the inorganic nutrients variability in space — higher concentrations allocated in the North and South-West parts of the Strait (Table 5.2.3a). Hence, in the Kerch Strait and the surrounding parts of the Azov Sea the present N was higher than in the Black Sea.
Table 5.2.3a. Concentration of organic nitrogen (N , pg/l) in the Kerch Strait and the Black Sea in the period of 30.11-07.12.2007. 0rg
| Range of Norg (|jg/l)/Area | Kerch Strait | ||
| Taman Bay | Central | South-West | |
| Surface | 260-380 | 180-270 | 330-370 |
| Bottom | 260-360 | 190-320 | 440-590 |
In average, content of the nutrients in the Kerch Strait was 1.5-2 times higher than those in the Black Sea. The same was discovered in the Azov Sea for ammonia and phosphates only (Table 5.2.3b).
Table 5.2.3b. Average nutrients concentrations (pg/l, above) and their range (below) in the surface and near bottom waters of the Kerch Strait region in the period of 30.11-07.12.2007.
| Area | Ammonia | Nitrites | ||
| surface | bottom | surface | bottom | |
| Azov Sea | 34 16-62 | 35 16-78 | 7.3 2.5-14 | 72.6-12 |
| Kerch Strait | 68 32-260 | 46 25-100 | 6.4 0.5-10.7 | 8.3 0.8-21 |
| Black Sea | 29 27-33 | 31 27-34 | 6.5 6-6.9 | 6.4 5.6-7.3 |
Statistical data (collected on 30 November-7 December) processed through the multiple correlation method allowed to identify — with high degree of probability — the Kerch shipwreck impact on two polluted spots (areas I and II on Fig. 5.2.3g respectively), (R = 0.75-0.99). One of them was located in the Chushka — Taman Bay direction and the other was located at the South-West of the Kerch Strait. High concentration of mineral and organic forms of nitrogen was identified there. Concentrations were 1.5-2 times higher than in the center of the shipwreck. Also, high concentration of organic matters and its biochemical labile part in the bottom sediments were discovered to evidence the prevailing of recovery processes. The differences of values of hydrochemical parameters of water quality and sediments in the selected areas indicate erosion of the oil spot and the flow of contaminated water associated with the transformation of water and sediment towards the Azov Sea. Similar data processing for the Azov Sea allowed identifying the area of residual effect of the shipwreck with the spread of biological pollutions radially from the Kerch Strait (Fig. 5.2.3f).

Fig. 5.2.3a. Water and bottom sediments sampling stations in the Azov and Black Seas in the period 30 November–7 December 2007.
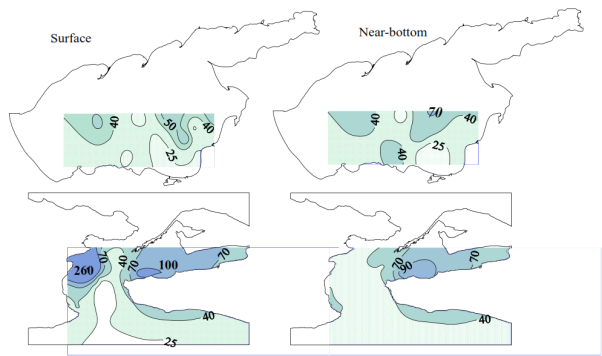
Fig. 5.2.3b. Spatial distribution of ammonia (µg / l) in the surface and near bottom waters of the Azov Sea (upper row) and the Kerch Strait (lower row) in the period of 30.11–07.12.2007.

Fig. 5.2.3c. Spatial distribution of nitrites (µg / l) in the surface and near bottom waters of the Azov Sea (upper row) and the Kerch Strait (lower row) in the period of 30.11–07.12.2007.
Table 5.2.3c. Chemical parameters of water and bottom sediments in the patches of residual influence of the Kerch oil spill in the period of 30 November-7 December 2007.
| Water, |jg/l | |||||
| Area | Ammonia | Nitrites | Nitrates | Phosphates | Norganic |
| Patch I | 55 | 9 | 19 | 17 | 290 |
| Patch II | 42 | 7 | 24 | 28 | 430 |
| Center of accident | 31 | 3 | 10 | 21 | 190 |
| Area III (background) | 33 | 6.5 | 9,7 | 18 | 240 |
| Azov Sea | 48 | 8.6 | 44 | 15 | 570 |

Fig. 5.2.3d. Spatial distribution of nitrates (µg / l) in the surface and near bottom waters of the Azov Sea (upper row) and the Kerch Strait (lower row) in the period of 30.11–07.12.2007.

Fig. 5.2.3e. Spatial distribution of phosphates (µg / l) in the surface and near bottom waters of the Azov Sea (upper row) and the Kerch Strait (lower row) in the period of 30.11–07.12.2007.
In the Kerch Strait, the Southern Scientific Centre of the Russian Academy of Sciences (SSC RAS) carried out 4 complex expeditions in November and December 2007 after the Kerch accident with participation of 18 experts specializing in various fields. The investigations included: pollution (petroleum hydrocarbons and trace metals) of the area affected by the accident; hydrological and hydrochemical characteristics of water; state of plankton and benthos communities (including plants and algae); ich- thyofauna; ornithofauna on the Taman Peninsula e. g. species composition, distribution, abundance of birds and number of dead birds (Matishov G. G. et al., 2008).
During the first days after the Kerch accident, the field trips were carried out by two groups — at sea and on the coast. The observations and sampling on coast covered the coastal zone of the Taman Bay, Chushka and Tuzla Spits, and the Russian Black Sea coast till the village of Volna (Fig. 5.2.4a). The concentration of petroleum hydrocarbons in the Kerch Strait waters varied in the range of 0.03-0.94 mg/l (18.8 MAC) and in certain areas their content was elevated in the near bottom layer most probably due to the sedimentation of the spilled heavy fuel oil. Less polluted were the inner parts of the Taman and Dinsky Bays and the area near the village of Taman.
From 11 to 15 December 2007, using the Master 450 boat, 36 CTD profiling stations were covered in the Kerch Strait by SSC RAS. In parallel, meteo-observa- tions, measurements of water transparency (Secci disc), pollution and inorganic forms of nutrients were carried out. Bottom sediments were sampled at 5 stations for pollution and at 30 for investigations of benthos. Compared to mid November, the concentration of TPHs in the water decreased down to the typical for the Strait level of 0.03-0.05 mg/l (Matishov G. G. et al., 2008). However, the part of the spilled heavy fuel oil, which gravitationally sank, got covered with sand and mud on the bottom. Possible re-suspension of this oil under stormy conditions was expected to cause secondary pollution of water and coast in the Kerch Strait.
5.2.5. UkrSCES (Ukraine): July and December 2009
5.2.5.1. July 2009 Kerch Strait (the 30th Vladymyr Parshin RV)
In line with the Ukrainian Integrated Ecological Monitoring Program, the Vladimir Parshin scientific research vessel undertook an expedition to the Azov and the Black Seas from 30 June to 10 July 2009 to study the current state of these marine environments. The expedition was divided into two parts. During the first one, the situation was observed at 9 stations in the North-Western part of the Black Sea shelf. During the second part 14 stations were sampled in the Kerch Strait.
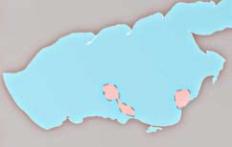
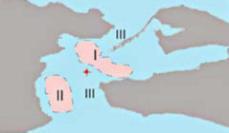
Fig. 5.2.3f. The patches of residual influence of the Kerch oil spill in the Kerch Strait and Azov Sea in the period of 30 November–7 December 2007.
The objective of the studies was to determine the effect, if any, of the oil spill in November 2007 (Fig. 5.2.5.1a). At each station, water samples from surface and nearbottom layers were collected. For standard hydrophysical measurements CTD-profiling system were used. Hydro chemistry covered dissolved oxygen concentration and nutrients. Total petroleum hydrocarbons (infra-red spectrophotometer) and aromatic hydrocarbons (spectrofluorometric) concentrations in marine waters are discussed in Chapter 6. In bottom sedi ments the contents of organic carbon, phenols, total petroleum hydrocarbons (TPHs), PAHs, chlorinated pesticides and trace metals were measured (Chapters 6, 7).
In the Kerch Strait all stations were in shallow waters, mainly at 5-10 m depth and the deepest one sat at 18 m only. Among hydrological parameters, salinity mainly indicated rather uniform water masses present in the Strait on 8 July 2009. Consequently, in these shallow mixed waters some parameters, such as pH showed rather narrow range of variation. In general, the oxygen concentration was high — above 100 % in the whole water column with a single exception in the Northern part of the studied area having at surface a 77.4 % of oxygen saturation only. The averages and ranges of variability of standard hydrochemical parameters sampled in the North-Western part of the Black Sea and in the Kerch Strait in July 2008 have a comparable level of variations (Tab. 5.2.5.1a).
Table 5.2.5.1a. Averages and ranges of variability of standard hydrochemical parameters measured in the North-Western part of the Black Sea and in the Kerch Strait on 08.07.2009, the 30th cruise of the Vladymyr Parshin RV.
| Parameter | N-W part of the Black Sea | |||
| Surface | Bottom | |||
| Average | Range | Average | Range | |
| N-NH4 Mg/l | 4.7 | 0-28 | 2.1 | 0-7.0 |
| N-NO2 Mg/l | 0.9 | 0.5-1.8 | 1.4 | |
| N-NO3 Mg/l | 4.6 | 2.9-9.2 | 5.7 | |
| N org Mg/l | 220 | 190 | ||
| N total Mg/l | 230 | 140-320 | 200 | |
| P-PO4 Mg/l | 11.2 | 1.9-27.6 | 17.8 | 5.2-53.3 |
| P total Mg/l | 35.3 | 8-80.0 | 43.7 | |
| pH | 8.34 | 8.28-8.44 | 8.17-8.24 | |
| BOD5 | ||||
The average concentration of easily decomposed organic substances in the Strait surface waters, measured by the BOD5 was 2.89 mg/l which was a rather moderate level. The range of variations was very high allowing distinguishing in between very clean and highly polluted waters. The highest value of BOD5 was recorded southward from the Tuzla Island. In near bottom layer the organic matter was in low concentrations (on the average of 1.71 mg/l, with variations in the range of 0.77-2.57 mg/l).
Organic nitrogen presented 96 % of the total N in the N-W part of the Black Sea and 90 % in the Kerch Strait. In bottom layers the distribution on N species was similar — 95 % in the North-Western part and 96 % in the Kerch Strait for the organic nitrogen in the amount of total N. Similar to the nitrogen, the organic forms of phosphorus were prevailing — 72 % and 78 % in surface waters of the N-W part and Kerch Strait correspondingly. In bottom layers these shares were — 56 % and 55 %. P-PO4 maximum was recorded in the deepest waters sampled in the Kerch Strait at the Black Sea entrance to the Strait.
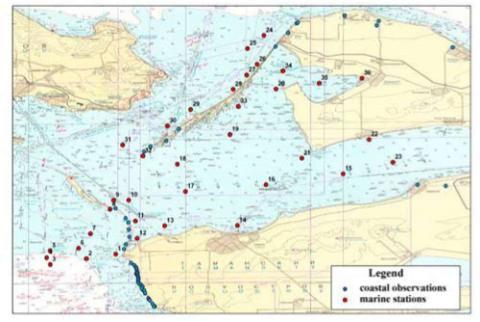
Fig. 5.2.4a. Sea and coastal sampling stations of SSC RAS expedition in November-December 2007.
The measurement undertaken during the summer season did not discover differences between sulphates concentrations in the Kerch Strait and the rest water areas, for example, in the North-Western part of the Black Sea shelf. Concentration of sulphates was of 1.2 g/l to 1.4 g/l. The expected increase in the concentrations of sulphates in the bottom layer of the Kerch Strait due to the sunken ships with sulphur was not discovered.
Concentration of suspended solids (SS) ranged from 1 mg/l to 250 mg/l in the Kerch Strait waters. Maximum concentration of suspended solids was observed in the Southern part of the Kerch Strait and close to the Tuzla Island. The concentration in the bottom layer was normally higher than in the upper ones. The high SS content usually negatively impacted on the bottom fish species and survival of larvae of valuable species, depressing growth of plankton.
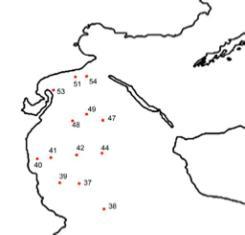
Fig. 5.2.5.1a. Sampling stations in the Kerch Strait during the 30th cruise of the «Vladymyr Parshin» RV on 8 July, 2009.
5.2.5.2. December 2009 Kerch Strait (the 31th Vladymyr Parshin RV)
The UkrSCES (Odessa) onboard of the Vladymyr Parshin RV (31st cruise) carried out complex investigations on the marine environment in the Azov and Black Seas including North-Western part of the Black Sea in the period of 4-15 December 2009 (Fig. 5.2.5.2a, Fig. 5.2.5.2b).
A wide spectrum of hydrological, hydrochemical, including pollution, and biological parameters were measured. Standard hydrophysical measurements by CTD (including permanent registration of temperature and salinity of surface waters), Secci disk depth, direction and velocity of currents by ADCP were conducted. Hydrochemistry covered nutrients concentration, BOD5 and organic carbon in the water. Pollutants studied were trace metals, detergents, aliphatic and aromatic hydrocarbons and elemental sulphur. In the bottom sediments the content of organic carbon, phenols, aliphatic, aromatic and polycyclic aromatic hydrocarbons (PAHs), chlorinated pesticides from DDT and HCH groups, sulphur and trace metals (Fe, Cd, Co, Hg, Cu, Pb, Cr, Zn, Ni, As, Al) were measured. Pesticides and PAHs in biota (bottom invertebrates) were also investigated. An extended biological programme covered determination of pigments concentration, abundance and biomass of phytoplankton, zooplankton, meiobenthos, phytobenthos, macrozoobenthos and some microbiological parameters. Radiological and geological studies were carried out in parallel. The total number of sampling stations was 85, at which 83 water and 32 bottom sediments samples were collected.
As a rule, concentrations of nutrient substances, oxygen and pH are stabilized due to attenuation of the biochemical processes during the winter period and the range of changes becomes narrower. However, high values of standard deviations indicate considerable variability of concentrations of Nttl and NH4 during the 2009 winter period (Table 5.2.5.2a). °a
The picture of spatial distribution of ammonia nitrogen in the surface and bottom layers in the Kerch Strait indicates a flow of ammonia present in the Black Sea waters as well as the polluted waters presence in areas close to urbanized territories of the central part of the Strait (Fig. 5.2.5.2c).
Table 5.2.5.2a. Statistics of hydrochemical parameters in the Kerch Strait on December 8-11, 2009.
| Parameters | N observations | Average | Median | Minimum | Maximum | Standard deviation |
| Surface layer | ||||||
| PH | 41 | 8.29 | 8.28 | 8.13 | 8.50 | 0.10 |
| Oxygen, mg/l | 41 | 9.99 | 10.33 | 8.82 | 11.01 | 0.64 |
| Oxygen, % | 41 | 97,7 | 97.7 | 95.7 | 101.4 | 1.29 |
| BOD5 mg/l | 15 | 1.69 | 1.84 | 0.71 | 2.46 | 0.51 |
| nNO, ^g/l | 26 | 2.01 | 2.0 | 0.1 | 4.7 | 1.33 |
| nNO3 ^g/l | 26 | 5.31 | 5.0 | 1.0 | 14.1 | 3.48 |
| nnH4, ^g/l | 26 | 7.98 | 6.8 | 0.7 | 31.2 | 7.38 |
| Ntota. ^g/l | 27 | 543.0 | 520 | 137 | 1071 | 278.0 |
| pPO4^g/l | 41 | 14.60 | 13.0 | 3.90 | 31.0 | 8.17 |
| Ptotal ^g/l | 27 | 39.5 | 38.0 | 14.0 | 56.0 | 10.9 |
| SO42-,jig/l | 27 | 866.2 | 816 | 624 | 1296 | 203.5 |
| Porganic,|jg/l | 27 | 25.1 | 27.4 | 3.0 | 50.6 | 12.91 |
| Norganic, |jg/l | 27 | 526.8 | 507 | 107 | 1054 | 279.8 |
| Corganic, mg/l | 27 | 5.47 | 4.48 | 1.88 | 20.9 | 3.74 |
| Suspended Solids, mg/l | 27 | 11.63 | 7.18 | 1.32 | 31.80 | 8.84 |
| Near-bottom layer | ||||||
| PH | 26 | 8.26 | 8.27 | 8.14 | 8.43 | 0.07 |
| Oxygen, mg/l | 26 | 10.08 | 10.36 | 9.08 | 10.62 | 0.55 |
| BOD5 mg/l | 14 | 1.5 | 1.5 | 0.4 | 2.8 | 0.73 |
| Oxygen, % | 26 | 96.90 | 96.9 | 95.5 | 99.0 | 0.98 |
| Nno2 jg/l | 27 | 1.95 | 1.7 | 0.1 | 6.9 | 1.58 |
| nno3 jg/l | 27 | 5.91 | 2.8 | 0.1 | 35.2 | 7.71 |
| ^hp jg/l | 27 | 7.49 | 6.7 | 0.7 | 29.6 | 6.63 |
| No-P jg/l | 25 | 567.7 | 660 | 70 | 996 | 296.1 |
| ppo4 jg/l | 26 | 15.97 | 15 | 3.9 | 36.1 | 10.08 |
| Pt„tal jg/l | 25 | 47.16 | 42 | 21.2 | 108 | 19.26 |
| SO42-,jg/l | 23 | 872.3 | 864 | 552 | 1464 | 210.1 |
| Porganic,jig/l | 25 | 31.5 | 31 | 0.0 | 85 | 21.21 |
| Norganic, jig/l | 25 | 551.7 | 624 | 62 | 989 | 293.6 |
| Corganic, mg/l | 24 | 8.08 | 5.61 | 2.21 | 37.10 | 8.38 |
| Suspended Solids, mg/l | 25 | 13.77 | 13.30 | 2.16 | 52.70 | 11.38 |
Minor standard deviations and close values of average and median of N-NO2 concentrations point to its little variations in surface and bottom layers (Table 5.2.5.2a). In general, spatial distribution of nitrites (Fig. 5.2.5.2d) was similar to ammonia. Concentrations of nitrates were not high, accompanied by insignificant variability. Prevalence of ammonium nitrogen in its oxidized forms should be noted. Most probably, during the observation period, the process of mineralization of organic matter was at the initial stage of its development.
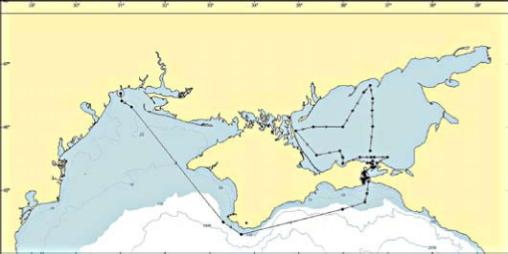
Fig. 5.2.5.2a. Map of sampling stations in the Azov and Black Seas during the 31st cruise of the Vlad- ymyr Parshin RV in the period of 4-15 December 2009.

Fig. 5.2.5.2b. Stations in the Kerch Strait sampled during the 31st cruise of the Vladymyr Parshin RV in the period of 4-15 December 2009.
A relatively high level of total nitrogen was discovered. Organic form of nitrogen pre-vailed over the mineral during the winter period similarly to the summer period. Judg¬ing from the standard deviation, spatial variability of concentrations of organic nitro¬gen was high (Table 5.2.5.2a). Organic form of phosphorus prevailed over the mineral one. Zones of high concentrations of Ptotal and P-PO4 were located closely to the costal pollution sources, similarly to the nitrogen zones observed (Fig. 5.2.5.2e).
Dissolved oxygen in the surface waters of the Kerch Strait varied broadly. The spatial distribution of oxygen in the waters of the Kerch Strait demonstrates that higher con-centrations of oxygen in 2009 winter were discovered in the Northern part of the Strait due to cold water flow from the Azov Sea. In the deep waters spatial distribution of dissolved oxygen concentration remained near identical to surface indicating the ab¬sence of vertical gradients in shallow waters (Fig. 5.2.5.2f).
Maximum rates of BOD5 were discovered in the Northern part of the Strait. However, absolute values were significantly lower than in summer. The maps of spatial distri¬bution show that zone of maximum easy oxidized organic matter in the surface and bottom layers of water were similar to spatial distribution of nutrients and they were related to the land based sources of pollution (Fig. 5.2.5.2g).
Unlike during summer, in December 2009 high concentration of sulphates was re¬corded in the near-bottom waters in the Kerch Strait. In upper layer their content was also rather high and varied from 624 to 1296 mg/l. However, these values were not related to the Kerch accident.
Studies have shown that the content of nutrients and easily oxidized organic matter in waters of Kerch Strait is slightly higher compared with other areas of the Black and Azov Seas. The high background concentrations were well associated with external sources of various forms of nutrients and organic matter in the marine environment, and most probably due to intensive human pressure. It is well known that intense flow of mineral and organic forms of nutrients is accompanied by increased photosynthetic pro¬cesses and the creation of a larger primary production which results in eutrophication. The signs of this process are the relatively high levels of BOD5 and consequent reduc¬tion of oxygen saturation in the near-bottom waters. Another indicator of an active re¬dox processes is concentration of ammonium and nitrite nitrogen. Their relatively high concentration signals the inflow of large quantities of organic substances.
5.2.6. MHI (Ukriane): December 2009 Kerch Strait near Tuzla Island
Short one-day screening of hydrochemical conditions in the surface waters of the Kerch Strait was carried out by MHI and MB UHMI (Sevastopol, Crimea) at 18 stations nearby the Tuzla Island on 4 December 2009. Standard parameters (salin¬ity, dissolved oxygen, pH and silicates) distribution were well related to a dominat¬ing Azov waters outflow to the Black Sea. The water parameters values were close to those in the Black Sea only at the South-Eastern side of the Tuzla Island.
Oxygen concentrations varied in the range of 9.3-11.1 mg/l and saturation was rather uniform — of 98-101 % in all studied area. Similar to the latter, the pH distribution was rather even within the range of 8.3-8.37, with only two lower values of 6.83 H 6.98 pH (to the North of the Tuzla Island) which might be outliers related to technical problems with equipment.
Among nutrients the concentration of phosphates was lower than the Detection Limit of 10 pg/l except for one station northward of Tuzla where 12 pg/l of P-PO4 were measured. The content of total phosphorus reached the level of 24 pg/l and higher concentrations were mainly located in the Northern part of the Strait, obviously under the influence of the Azov Sea waters.
The nitrites concentration was lower than the Detection Limit of 5 pg/l. The same situ¬ation occurred for nitrates and ammonia (DL=10 pg/l) with exception of two stations near the Northern side of Tuzla having the mentioned forms of nitrogen in the range of 15-22 pg/l. The total nitrogen concentration reached 426 pg/l and the ratio of Ntotal/Ptotal stands at 18 in December 2009, being close to Redfield ratio, whereas it was 40 in Feb¬ruary 2008.
The detergents and phenol concentrations were lower than DL at all stations, 25 and 3 pg/l correspondingly.
5.2.7. YugNIRO (Ukraine): November 2007-March 2009
The Institute conducted 7 field trips in the Central and South parts of the Kerch Strait in the period of November 2007-March 2009, as is described in Annex 2. The con¬siderable increase in monitoring effort after the Kerch accident was evidenced by 8 field trips in 2002-2007 versus 7 cruises in less than 1.5 year after the catastrophe. Among standard hydrochemical investigations, salinity, pH, dissolved oxygen, BOD5, sulphur and different forms of nutrients were measured in surface and near bottom lay¬ers. The sampling stations were placed mainly in the transshipment anchor place located South to the Tuzla Island (12 stations) and in the Kerch Bight (6 stations).


Fig. 5.2.5.2c. Ammonia distribution (µg / l) in the upper (left) and near-bottom (right) layers in the Kerch Strait on December 8–11, 2009 (the 31th cruise of the V. Parshin RV).

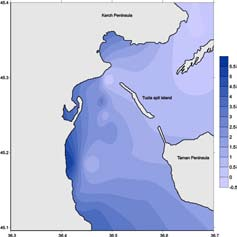
Fig. 5.2.5.2d. Distribution of nitrites (µg / l) in the upper (left) and near-bottom (right) layers in the Kerch Strait on December 8–11, 2009 (the 31th cruise of the V. Parshin RV).
After the Kerch accident, TPHs and sulphur concentrations were measured annually at six stations in the central part of the Strait (Sebah L. K. et al., 2008, Sebah L. K. et al., 2010, Zhugailo S. S. et al., 2011).
Traditionally, salinity was lower in the upper layer and interannually there was no trend in its variability (Table 5.2.7a). In the whole water column pH varied insignificantly, with general increase from spring to autumn related to active photosynthesis.
The dissolved oxygen concentration varied in a very wide range. In surface water the oxygen regime was without deviation from the norm. In the near-bottom water oxygen was lower than at surface, with minimal value of 3.80 mgO2/l observed in November 2007. However, water temperature was the main influencing factor on the oxygen variability.
After the Kerch accident, the BOD5 level was below 3.0 mgO2/l and the values observed did not show abnormality (usually, minimal values of BOD5 are recorded in winter). Maximal values were observed in autumn 2009-4.22 mgO2/l, unrelated to the accident.

Fig. 5.2.5.2e. Concentration (µg / l) of phosphates (left) and total phosphorus (right) in the Kerch Strait surface waters on December 8–11, 2009 (the 31th cruise of the V. Parshin RV).
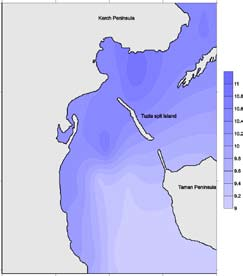

Fig. 5.2.5.2f. Concentration (mg / l) of dissolved oxygen in the upper (left) and near-bottom (right) layers in the Kerch Strait on December 8–11, 2009 (the 31th cruise of the V. Parshin RV).
Table 5.2.7a. Concentration of hydrochemical parameters in the Kerch Strait in 2007-2009.
| Date | Salinity, %% | PH | Oxygen, mg/l | BOD5, mgO2/l | ||||||||
| Aver. | Min. | Max. | Aver. | Min. | Max. | Aver. | Min. | Max. | Aver. | Min. | Max. | |
| Surface layer | ||||||||||||
| 09.2007 | - | 17.60 | 17.96 | 8.17 | 8.05 | 8.21 | 6.89 | 6.33 | 7.33 | 1.27 | 0.30 | 2.29 |
| 10.2007 | - | 17.50 | 17.82 | 8.35 | 8.10 | 8.49 | 8.42 | 8.21 | 9.11 | 1.14 | 0.64 | 2.40 |
| 02.2008 | 16.20 | 11.69 | 17.84 | 8.58 | 8.32 | 8.70 | 11.14 | 9.37 | 13.23 | 1.18 | 0.60 | 2.59 |
| 04.2008 | 16.64 | 16.37 | 17.15 | 8.28 | 8.02 | 8.35 | 8.38 | 8.10 | 8.69 | 0.98 | 0.36 | 1.57 |
| 09.2008 | 16.38 | 14.76 | 17.78 | 8.40 | 8.15 | 8.45 | 7.88 | 6.84 | 8.71 | 0.93 | 0.04 | 1.59 |
| 11.2008 | 17.82 | 17.65 | 17.95 | 8.47 | 8.20 | 8.56 | 9.36 | 8.44 | 10.18 | 0.64 | 0.04 | 1.20 |

Fig. 5.2.5.2g. Concentration (mg O2/l) of organic matter measured by BOD5 in the upper (left) and near- bottom (right) layers in the Kerch Strait on December 8-11, 2009 (the 31th cruise of the V.Parshin RV).
| 03.2009 | 11.13 | 10.72 | 13.10 | 8.34 | 8.00 | 8.42 | 11.42 | 10.21 | 12.37 | 1.04 | 0.01 | 1.82 |
| 06.2009 | 16.11 | 16.34 | 17.21 | 8.35 | 8.32 | 8.37 | 8.38 | 7.82- | 8.85 | 1.44 | 0.83 | 2.22 |
| 09.2009 | 17.15 | 17.03 | 17.15 | 8.44 | 8.42 | 8.47 | 7.93 | 6.05 | 10.10 | 0.75 | 0.34 | 1.30 |
| 10.2009 | 15.26 | 17.49 | 17.86 | 8.52 | 8.49 | 8.55 | 8.92 | 8.54 | 9.28 | 0.85 | 0.07 | 1.81 |
| Near-bottom layer | ||||||||||||
| 09.2007 | - | 17.75 | 18.02 | 8.17 | 8.07 | 8.21 | 6.27 | 3.80 | 7.19 | 2.11 | 1.13 | 3.83 |
| 10.2007 | - | 17.62 | 17.80 | 8.35 | 8.07 | 8.42 | 8.41 | 8.01 | 9.18 | 1.08 | 0.94 | 1.92 |
| 02.2008 | 16.99 | 15.40 | 17.84 | 8.54 | 8.05 | 8.65 | 10.58 | 9.40 | 11.49 | 0.85 | 0.51 | 1.60 |
| 04.2008 | 16.83 | 16.57 | 17.13 | 8.28 | 8.10 | 8.35 | 8.09 | 7.63 | 8.35 | 1.35 | 0.59 | 1.77 |
| 09.2008 | 17.33 | 15.48 | 17.84 | 8.4 | 8.30 | 8.45 | 7.58 | 4.82 | 8.28 | 1.26 | 0.70 | 2.02 |
| 11.2008 | 17.82 | 17.62 | 17.98 | 8.49 | 8.27 | 8.56 | 9.09 | 5.65 | 9.94 | 0.97 | 0.06 | 2.30 |
| 03.2009 | 16.91 | 16.46 | 17.35 | 8.35 | 8.10 | 8.42 | 9.77 | 8.04 | 10.67 | 0.49 | 0.10 | 1.56 |
| 06.2009 | 16.86 | 17.01 | 17.98 | 8.30 | 8.15 | 8.37 | 9.00 | 8.34 | 9.49 | 2.43 | 1.14 | 3.53 |
| 09.2009 | 17.10 | 13.74 | 16.60 | 8.45 | 8.42 | 8.45 | 7.81 | 7.22 | 8.14 | 1.22 | 0.31 | 4.22 |
| 10.2009 | 17.73 | 16.34 | 17.21 | 8.49 | 8.43 | 8.53 | 8.46 | 7.56 | 9.13 | 0.96 | 0.07 | 2.15 |
In 1998-2007 the increasing content of mineral nitrogen in the waters of the Strait followed on the intensification of re-loading of fertilizers in the transshipment area south to the Tuzla Island (Table 5.2.7b). Later this practice was terminated but concentration of some nutrients remained rather high. Maximal levels were recorded in the Northern-Western part during all period of investigations. The latter could be dependent on the water dynamics changes after the dam construction at the Tuzla Spit (Goriachkin Yu. N. etal., 2007, Ovsienko S. N. etal., 2008).
The average concentration of ammonia and nitrites in the near-bottom layer was higher than at surface. Ammonia maximum was usually recorded in spring which is not typical for marine environments. Nitrates level was increased during all seasons.
Sulphates concentration after the Kerch accident did not change atypically. In general, averages were in the range of the long-term interannual variability and varied from 1.22 g/l to1.43 g/l.
Table 5.2.7b. Concentration of mineral nitrogen in the Kerch Strait in 2007-2009.
| Date | Aver. | Min. | Max. | Aver. | Min. | Aver. | Min. | Max. | |
| Surface layer | |||||||||
| 09.2007 | 11.7 | 0.0 | 38.9 | 3.0 | 3.0 | 3.0 | 114.6 | 4.5 | 603.4 |
| 10.2007 | 21.8 | 1.6 | 101.1 | 3.0 | 3.0 | 3.0 | 61.5 | 24.9 | 205.7 |
| 02.2008 | 45.1 | 15.6 | 101.1 | 3.6 | 2.7 | 6.1 | 25.5 | 6.8 | 81.4 |
| 04.2008 | 10.9 | 3.9 | 23.3 | 2.7 | 0.9 | 3.0 | 49.5 | 1.1 | 488.2 |
| 09.2008 | 14.8 | 7.8 | 31.1 | 4.0 | 3.0 | 6.1 | 29.4 | 18.1 | 65.5 |
| 11.2008 | 10.1 | 0.0 | 85.6 | 0.0 | 0.0 | 0.0 | 31.9 | 9.0 | 146.9 |
| 03.2009 | 38.1 | 23.3 | 62.2 | 3.0 | 3.0 | 3.0 | 14.0 | 6.8 | 20.3 |
| 06.2009 | 0.8 | 0.0 | 7.8 | 3.0 | 3.0 | 3.0 | 17.2 | 9.0 | 63.3 |
| 09.2009 | 14.0 | 0.0 | 23.3 | 1.8 | 0.0 | 3.0 | 21.0 | 18.1 | 38.4 |
| 10.2009 | 29.6 | 15.6 | 54.5 | 4.0 | 3.0 | 6.1 | 20.1 | 11.3 | 42.9 |
| Near-bottom layer | |||||||||
| 09.2007 | 18.7 | 3.9 | 62.2 | 3.0 | 3.0 | 3.0 | 25.5 | 9.04 | 106.22 |
| 10.2007 | 39.7 | 7.8 | 163.4 | 5.2 | 0.3 | 9.1 | 63.7 | 27.12 | 230.52 |
| 02.2008 | 64.6 | 15.6 | 140.0 | 4.3 | 3.0 | 9.1 | 35.5 | 4.52 | 135.6 |
| 04.2008 | 25.7 | 23.3 | 31.1 | 3.0 | 3.0 | 3.0 | 24.9 | 1.13 | 101.7 |
| 09.2008 | 25.7 | 15.6 | 46.7 | 4.9 | 3.0 | 18.2 | 33.7 | 15.82 | 128.82 |
| 11.2008 | 7.8 | 0.0 | 85.6 | 0.0 | 0.0 | 0.0 | 20.8 | 9.04 | 74.58 |
| 03.2009 | 59.1 | 38.9 | 77.8 | 4.6 | 3.0 | 6.1 | 11.3 | 6.78 | 24.86 |
| 06.2009 | 21.8 | 0.0 | 7.8 | 3.3 | 3.0 | 6.1 | 18.1 | 9.04 | 92.66 |
| 09.2009 | 29.6 | 15.6 | 62.2 | 3.6 | 3.0 | 6.1 | 21.0 | 15.82 | 33.9 |
| 10.2009 | 6.2 | 0.0 | 31.1 | 3.0 | 3.0 | 3.0 | 25.5 | 13.56 | 42.94 |
5.2.8. Nutrients exchange between the Black and Azov Seas in 2008-2009
Data observed at the cross-section of the ports Crimea — Caucasus in the Ukrainian water area in 2008-2009 were used to calculate nutrients exchange between the Azov and Black Seas (Fig. 2c). Hydrological parameters investigated were: temperature and salinity, flows directions and velocity. In addition, transparency, water color and meteorological parameters (wind directions and velocity, air temperature and humidity, atmospheric pressure, clouds) and waves were measured.
The methodology used to calculate the nutrients flow through the Northern narrowest place of the Kerch Strait was developed as follows. Flows and nutrient concentrations measured at different stations in 1981-1998 were linearly interpolated to the nodes of a grid with a step of 100 m horizontally and 1 m vertically. Then, flow of matters was identified for the total cross section and for the Ukrainian part separately. According to the obtained flow values, flow charts of the scattering were established. Then, based on a result of regression analysis and data collected at the Ukrainian part of the cross section, the equation for calculating the nutrients flow from the Ukrainian part were identified. It should be noted that zero flow cases were not included in the analysis for non-organic forms of nitrogen (nitrites and nitrates). The results of studies showed that flow of each element can be adequately represented in the form of equations of linear regression.
The equations allowed calculating matters flows through the Northern narrowest place of the Kerch Strait for 2008-2009. Due to the lack of data for establishment of regressions, nitrogen flows were calculated for the Ukrainian part of the Strait only.
The analysis of field observation data collected showed that the flow is unidirectional in the narrow parts of the Strait and is characterized by considerable variability in large parts of it. At the direction there are three distinct types of flows: the Azov, Black Sea and the mixed one. First two are fairly stable and provide the greatest water flow, so it makes sense to consider the flow of nutrients according to the predominant flows. It should be mentioned that the Azov and Black Sea flows are fairly easily identified by their different thermohaline structure of water and hydrochemical characteristics.
The predominance of the water flow from the Sea of Azov to the Black Sea is typical for the Strait since this was observed by about 47 % of the total number of observations (Altman E. N., 1975, 1976, Simonov A. I., Altman E. N., 1991). The repeatability of Azov flow was 46 % in 2008-2009 which is close to the mean rate (Fig. 5.2.8a). This transfer occurs when winds are northerly, as well as determined by the dynamics of river flows into the Azov Sea. The Azov Sea flows dominated in June-July 2008 and in April — May 2009. The average discharge from the Azov Sea was 3530 m3/sec during 2008-2009 with maximum of 7570 m3/sec.
The Black Sea types of flows are mostly formed by winds of the Southern directions. Its rate was 33 % of the total number of observations in 2008-2009. The frequency of mixed flows of variable directions was 21 %. The Black Sea and mixed flow prevailed in April and May and in August-October 2008. The average discharge of the Black Sea flow was about 3,120 m3/sec and maximum as of 7820 m3/sec.
The positive flow values of nitrites, total nitrogen, and phosphorus in 2008-2009 are those to the Kerch Strait and to the Black Sea and the negative ones are to the Azov Sea (Fig. 5.2.8a — d). Nitrites flow to the Azov Sea through the Northern narrowest place were observed in May (8.07 g/sec), in August (from 0.17 g/sec to 0.37 g/sec), and in September (from 5.07 g/sec to 5.19 g/sec) 2008. Nitrites were moving to the Kerch Strait from the Azov Sea in September (from 2.02 g/sec to 3.86 g/sec), in October (0.59 g/sec), and in June (0.97 g/sec) 2009.
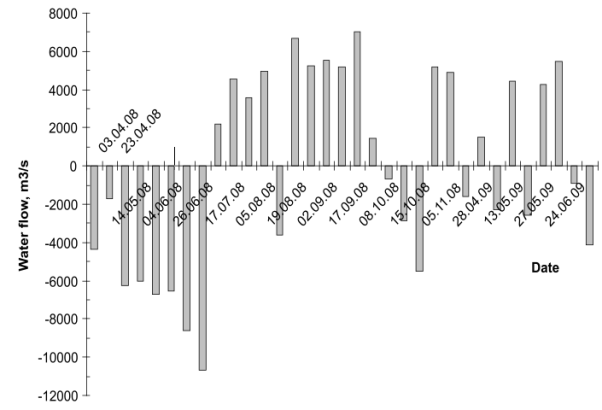
Fig. 5.2.8a. The calculated water exchange (m3/sec) between the Azov and Black Seas across the Kerch Strait in 2008-2009. Plus is related to the water inflow from the Azov to Black Sea and minus — to the backward outflow.
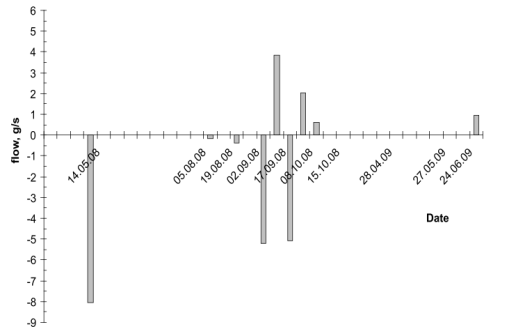
Fig. 5.2.8b. The calculated nitrites exchange (g/sec) between Azov and Black Seas across the northern narrowest place of the Kerch Strait in 2008-2009.
Flow of ammonia nitrogen from the Azov Sea prevailed during the spring 2008 (from 115 g/sec to 210 g/sec). This inflow of ammonia into the Kerch Strait and further to the Black Sea was calculated for the whole observation period. The outflow varied from 40 g/sec to 154 g/sec during the spring season and from 3 g/sec to 60 g/sec during the summer and autumn seasons.
The total nitrogen flows through the Northern narrowness of the Strait from the Azov Sea was observed more frequently (Fig. 5.2.8c). However, this discharge was much lower and varied from 50 g/sec to 2900 g/sec. The opposite flow brings Ntotal into the Azov Sea at higher intensity of 500 to 4500 g/sec.
Total phosphorus flow dominated throughout the period of observation in 2008-2009 with the Azov Sea waters passing through the Kerch Strait into the Black Sea. Its capacity varied from 15 g/sec to 1500 g/sec. The discharge of phosphorus into the Azov Sea was in order of magnitude lower from 23 g/sec to 140 g/sec (Fig. 5.2.8d).

Fig. 5.2.8c. The calculated total nitrogen exchange (g/sec) between the Azov and Black Seas across the Northern narrowest place of the Kerch Strait in 2008-2009
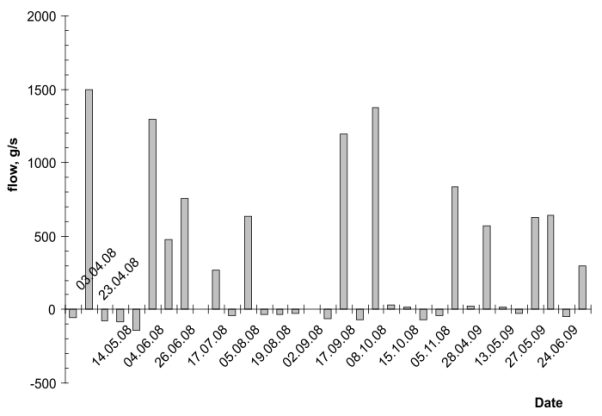
Fig. 5.2.8d. The calculated total phosphorus exchange (g/sec) between the Azov and Black Seas across the Northern narrowest place of the Kerch Strait in 2008-2009.
There were no long-term visible consequences reflected in the standard hydrochemi¬cal parameters of the Kerch Strait waters that could be related to the heavy oil spill accident on 11 November 2007. Rather classical distribution of chemical parameters has been registered soon after the accident, which can be described as follow. In gen¬eral, the shallow waters of the Strait significantly differ from the adjacent areas of the Azov and Black Seas. Usually, it is expressed by an increased content of nutrients and some pollutants, especially in those areas of the Strait located close to the coasts. The level of nutrients, suspended matter and pollutants in the Kerch Strait is higher than in the North-Eastern part of the Black Sea. The increased baseline concentra¬tions of nutrients are quite stable in these waters and well related to external land- based or ship-borne sources. The calculations of nutrients transportation clearly re¬flect a main flow from the Azov to the Black Sea for many substances, including total phosphorus, however, total nitrogen indicates opposite tendency. Despite of the high level of nutrients, the waters in the Strait are well saturated with oxygen; no hypoxic or anoxic situations have been ever registered. In some cases low content of oxy¬gen in bottom layers occurs but without consequent mass mortalities of organisms. The complex Index of Water Pollution indicates the «clean» or «moderately polluted» water quality in the period 2003-2008. Despite of the oil spill accident in November 2007, the waters in the Strait have been still qualified as «clean» though IWP slightly increased to 0.52.
There were no long-term visible consequences reflected in the standard hydrochemi¬cal parameters of the Kerch Strait waters that could be related to the heavy oil spill accident on 11 November 2007. Rather classical distribution of chemical parameters has been registered soon after the accident, which can be described as follow. In gen¬eral, the shallow waters of the Strait significantly differ from the adjacent areas of the Azov and Black Seas. Usually, it is expressed by an increased content of nutrients and some pollutants, especially in those areas of the Strait located close to the coasts. The level of nutrients, suspended matter and pollutants in the Kerch Strait is higher than in the North-Eastern part of the Black Sea. The increased baseline concentra¬tions of nutrients are quite stable in these waters and well related to external land- based or ship-borne sources. The calculations of nutrients transportation clearly re¬flect a main flow from the Azov to the Black Sea for many substances, including total phosphorus, however, total nitrogen indicates opposite tendency. Despite of the high level of nutrients, the waters in the Strait are well saturated with oxygen; no hypoxic or anoxic situations have been ever registered. In some cases low content of oxy¬gen in bottom layers occurs but without consequent mass mortalities of organisms. The complex Index of Water Pollution indicates the «clean» or «moderately polluted» water quality in the period 2003-2008. Despite of the oil spill accident in November 2007, the waters in the Strait have been still qualified as «clean» though IWP slightly increased to 0.52.
Chapter 6. Petroleum Hydrocarbons Pollution
Ivanov A., Tkachenko Yu., Derbicheva T., Ilyin Yu., Malchenko Yu., Shibaeva S., DjakovN., GozhikP., Bagriy I., Ivanova A., Petrenko O., Zhugailo S., Sapozhnikov V., Korshenko A., Panova A., Krutov A., Ermakov V., Kochetkov V., Komorin V., Orlova I., PavlenkoN., Denga Yu., Chasovnikov V., BelyaevN., Kolyuchkina G., Shapovalova E., Simakova U., Nasurov A., Mironov O., Alyomov S., Basar E., Kutaeva N., Pisheva D., Patlatyuk E.
6.1.1. Major oil spill accidents in the Black Sea region
6.1.2. USSR/UA: Historical data collected in the period of 1981-2007
6.1.3. Observations after the Kerch Strait accident
6.1.4. UA: National Monitoring System. The Kerch Strait in 2007-2009
6.1.5. UA: YugNIRO. November 2007 and February, April, May 2008
6.1.6. UA: IBSS. 9-17 December 2007
6.1.7. UA: MHI and MB UHMI. Observations in the Kerch Strait in De-cember 2007, March 2008 and December 2009
6.1.8. UA: UkrSCES. The Kerch Strait in July and December 2009 (30th and 31st cruise of the Vladymyr Parshin RV)
6.1.9. Petroleum hydrocarbons inter-seas exchanges in 2008-2009
6.1.10. RU: Kuban HMS. Monitoring of the Russian waters in 2007-2009
6.1.12. RU: ChAD. Cruise observations in July, August, November and December 2008
6.1.13. Summary: Presence of petroleum hydrocarbons in the water
Most widespread and hazardous substances to pollute the environment, including marine waters. They negatively affect most of the organisms and the trophic chain in entirety. The PHs presence in the natural water bodies result in the water quality change to become visible because of bacteria increase in number (e.g. PHs oxidizing bacteria); the water organoleptic property change; increase of the dissolved organic substances concentration including such toxic substances as phenols, naphtols, and others; the elevated nutrients concentration; occasionally intensive development of the zooplankton and phytoplankton opportunistic species. Ultimately, PHs are asso¬ciated with displacement, disturbance or loss of biota — fish and wildlife particu¬larly — as well as loss of habitats, degradation of beaches and many other negative phenomena. The most toxic for marine life PHs are the light fractions.
6.1.1. Major oil spill accidents in the Black Sea region
An oil spill is a release of petroleum into the natural environment. As such, oil flows along the sea surface often reaching the shore and severely damaging rich ecosys¬tems in the shallow waters and life on the coasts. The shoreline habitat may need up to 30 years to recover from a major oil spill. Spill accidents may happen during the oil loading or transportation. Actually, the term 'oil spill" often refers to marine oil spills when petroleum is released into the sea from the damaged tankers. Thus, oil tankers are the boats that most likely might cause major environmental damage worldwide including the Black Sea region as well.
Table 6.1.1a. Oil spills from 1960 to 2002 at the Turkish coasts.
| Date | Ship Name | Ship Flag | Accident Area | Amount of Oil Spilled | Cause |
| 14.12.1960 | World Harmony, Peter Zoranic | Greece Yugoslavia | the Bosporus Strait, Kanlica | 18,000 tons | Collision and fire |
| 15.09.1964 | Norborn, Wreck of Peter Zoranic | Norway Yugoslavia | the Bosporus Strait, Kanlica | Unknown | fire |
| 01.03.1966 | Lutsk,Krasnyi Oktyabr | USSR USSR | the Bosporus Strait, Kizkulesi | 1,850 tons | Collision and fire |
| 10.08.1977 | USSR-1 | USSR | the Bosporus Strait | 20,000 tons | Rana ground |
| 25.12.1978 | Kosmos M | Akbas, the Dardanelles (Canakkale) Strait | 10,000 tons | Unknown | |
| 15.11.1979 | Independentia, Evriali | Romania Greece | Southern entrance of the Bosporus Strait | 30,000 tons, got burnt64,000 tons spilled | Collision and fire |
| 09.11.1980 | Nordic Faith, Stavanda | GreatBritain,Greece | the Bosporus Strait | Unknown | Collision and fire |
| 29.10.1988 | Blue Star, Gaziantep | Malta, Turkey | the Bosporus Strait, Ahirkapi | 1,000 tons, ammonium spill | Collision |
| 25.03.1990 | Jambur, Da Tung Shan | Iraq, China | the Bosporus Strait, Sariyer | 2,600 tons | Collision |
| 13.03.1994 | Nassia, Shipbroker | Republic of Cyprus | the Bosporus Strait | 9,000 tons spilled 20,000 tons burnt | Collision, Got burnt |
| 07.12.1999 | Semele, Shipka | Belize, Bulgaria | the Bosporus Strait, Yenikapi | 10 tons | Collision |
| 06.10.2002 | Gotia | Malta | the Bosporus Strait, the Emirgan quay | 20 tons | Stranding, rammed |
The largest in the past 20 years oil spill in the Black Sea occurred when the Nassia tanker and the Shipbroker cargo vessel collided in the Bosporus Strait on 13 March 1994. Shipbroker got totally burnt. The major part of Nassia's cargo (it was carrying 98,600 tons of crude oil) was spilled over into the sea and together with 20,000 tons of burnt oil caused severe marine and air pollution on the Bosporus, and in the Black and Marmara Seas (Cabioc'h F., 1998).
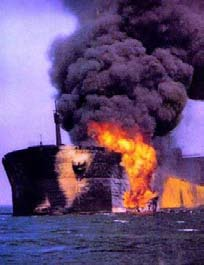
Photo: WT Nassia on 13 March 1994.
In the Marmara Sea, nearly 450 different scale accidents were reported within the last 40 years. One of them was the 1997 accident of the Trao tanker that exploded in the Tuzla shipyards located on the North-Eastern cost of the Marmara Sea (Kazezyilmaz M. C .et al, 1998). Some of those events had a severe impact on the environment.
Several ship accidents happened during the past 20 years by the Black Sea coast of Bulgaria, Romania, Russia and Ukraine, however, they mostly brought small-scale oil spills or other kind of pollution.
6.1.2. USSR/UA: Historical data collected in the period of 1981-2007
Between the ports of Crimea and Caucasus located in the narrowest part of the Kerch Strait, routine monitoring of petroleum pollution was started in 1981 (Table 6.1.2a). The total number of stations observed in 1981-2007 was 2,075, while no observations were carried out in 1987, 1990, 1991, 1993 and 1996. Since 2001, the Opasnoe HMS has monitored regularly TPHs at 100-200 stations on a decadal basis (see Subchapter 5.1 also).
In the late 1990s, petroleum pollution of the Kerch Strait has significantly increased (up to 3 MAC in average) in comparison with the early 1990s, and petroleum hydro¬carbons were detected in every sample collected. The absolute maximum for the whole period of investigations (2.96 mg/1 or 59 MAC) was recorded in October 1982 in the surface waters. Maximal average values in the long-term run were recorded
in the period 1995-1998, there is no evidence available whether this elevated level of pollution was related to land-based sources or to shipping. Since 2000, the level of TPHs has decreased to 1-2 MAC with repetition of above 1 MAC concentration in 44-94 % of total samples collected (Fig. 6.1.2a).
Table 6.1.2a. Monitoring stations at the ports of Crimea and Caucasus transect in the Kerch Strait narrowest part.
| No | N | E | Depth | Class | Parameters |
| the Opasnoe MHS: the Kerch Strait, the ports of Crimea and Caucasus transect | |||||
| 6 | 45°22'24" | 36°38'36" | 4.7 | II | 0„ Alk, S%«, P,, „ P-PCX, Si-SiCX,2' ' ' total' 4' 4'N-N02, N-N03, N-NH4, TPHS, Detergents, Phenols |
| 7 | 45°22'12" | 36°39'00" | 7.8 | II | The same |
| 8 | 45°21'54" | 36°39'24" | 7.5 | II | The same |
| 9 | 45°21'36" | 36°39'54" | 7.4 | II | The same |
| 10 | 45°21'18" | 36°40'12" | 7.0 | The same | |
| 11 | 45°21'12" | 36°40'30" | 6.4 | The same | |
| 12 | 45°20'56" | 36°40'44" | 5.8 | The same | |

Fig. 6.1.2a. Concentration of petroleum hydrocarbons and detergents in the waters of the Kerch Strait Northern narrowest part in 1981-2007.
In the PHs seasonal dynamics, two periods of low concentrations presence in the Kerch Strait waters (below 1 MAC) are distinguished traditionally, i. e., in winter (Janu¬ary-February), and in summer (July-August), (Fig. 6.1.2b). Correspondingly, maxi¬mal levels are recorded in autumn (September-November) and spring (April-June). The minima and maxima can be interpreted as follows. In winter the wind-wave activ¬ity grows, while in summer the water temperature raises, and the former and the latter facilitate the decrease in concentrations of TPHs. In spring (before the high water of the rivers Don and Kuban), and in autumn the frequency of the Black Sea flow (from the Black to the Azov Sea) is increased, and this flow brings polluted waters from the transshipment areas to the narrowest part of the Kerch Strait, where the Ukrainian monitoring takes place.
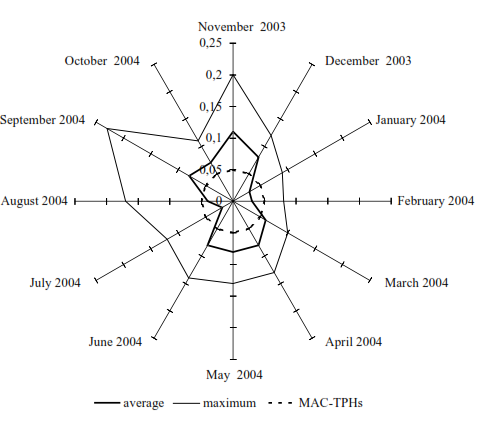
Fig. 6.1.2b. Seasonal distribution of petroleum hydrocarbons concentration in the waters of the Kerch Strait Northern narrowest part in November 2003-October 2004.
In 1992–2000, an average content of TPHs in the Kerch Bight waters sustained 0.01–0.13 mg / l (Zhugailo S. S.et al., 2008). The maximum concentrations were recordedin the shipyard vicinity where too many boats were usually brought for temporaryanchoring. Also, the local Primorskaya river could have been an additional source.The bight coastal zone was heavily polluted and PHs were the main impacting pollutantthroughoutthe1990s(PetrenkoO.A.,2008).Lateron,in2000–2007theTPHspresencelevel increased further on toreach0.04–0.28 mg/l(Fig. 6.1.2c).

Fig. 6.1.2c. Annual average concentration (mg / l) of total petroleum hydrocarbons in the Kerch Bight waters in 2000–2007 (Zhugailo S. S . et al., 2008).
YugNIRO, Kerch conducted numerous oceanological field investigations in the Kerch Strait area. The institute is located at the strait Ukrainian coast and is engaged with monitoring the Kerch Strait environmental conditions. From 2002 and till the Kerch Strait catastrophe, YugNIRO carried out eight expeditions in the Strait, measured petroleum hydrocarbons levels and — in addition — surveyed the standard hydrochemistry parameters (incl. nutrients), trace metals and chlorine hydrocarbons as well as the plankton and benthos communities. In 2002-2007, altogether 184 stations were sampled and in total 191 water samples and 147 bottom sediment samples were col¬lected. The expeditions description is given in Annex 2.
6.1.3. Observations after the Kerch Strait accident
Numerous scientific investigations were conducted after the Kerch Strait accident of November 2007 and an obvious overlapping of different institutions activities hap¬pened in their course. Some of the studies conducted included visual observation of the Kerch Strait sea surface and shoreline. The main purpose of investigations was to find out, where and in what area the heavy fuel oil released from the Volgoneft- 139 tanker had spread over and — finally — where it had arrived at the coast to. Simultaneously, information/data required for damage assessments of the accident were collected. Few expeditions engaged the divers to do the underwater direct ob¬servations of the marine ecosystem status to include large animals like mussels and marine grasses. Most numerous were traditional oceanographic expeditions to collect the samples onboard, i. e., hydrological and hydrochemical, though not only. A spe¬cial attention was paid to marine waters, bottom sediments and biota extent of pollu¬tion by sulphur, pesticides, PCBs, PAHs and trace metals. In total, about 60 different complex cruises were conducted in 2007-2009 (after the Kerch Strait accident) by various Russian and Ukrainian scientific institutions. The list of expeditions is pre¬sented in Annex 2.
The following Russian institutions were engaged with extensive studies of the Kerch Strait accident consequences: the Shirshov Institute of Oceanology (Moscow) and its Southern Branch (Gelendzhik), the RAS Southern Scientific Center (Rostov-on-Don), AzNIIRKH (Rostov-on-Don), the Kuban Estuarine Station (Temruk) and the Black- Azov Seas Directorate (Novorossiysk). In Ukraine, complex investigations were car¬ried out by the Marine Hydrophysical Institute (MHI), the Southern Seas Biology In¬stitute (IBSS) and the UHMI Marine Branch (all from Sevastopol), YugNIRO (Kerch) and UkrSCES (Odessa). Many scientists and technical experts took part in the sam¬ples analysis, and database and materials compilation. The lists of leading scientists and institutions who participated in different investigations are presented in Annexes 1 and 4 correspondingly.
6.1.4. UA: National Monitoring System. The Kerch Strait in 2007-2009
At the ports of Crimea and Caucasus transect located in the Kerch Strait Northern narrowest part, 35 cruises were carried out by the Opasnoe HMS of the Ukrainian Hydrometeorological Service in April-November 2008 and April-June 2009. Four permanent stations have been regularly observed in the frameworks of the Ukrainian routine monitoring program (Fig. la, see Chapter 1), Table 6.1.2a, stations No 6-9).
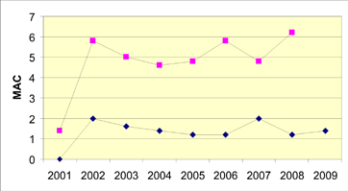
Fig. 6.1.4a. TPHs concentration, average (blue) and maximum (rose), expressed in MAC in 2001–2009.
In 2008, 280 samples were collected and numerous hydrochemical parameters were studied in parallel with petroleum hydrocarbons (Chapter 5). TPHs concentrations var¬ied from analytical zero to 0.31 mg/1 (6.2 MAC) in the bottom layers, while reaching up to 0.24 mg/1 at the surface. The maximum was observed in August in the near-bot¬tom layer close to the port of Caucasus. The TPHs average value for the water column was 0.06 mg/1, i. e., 1.7 times lower than in 2007, though in general it remained at the typical for the area annual level (Fig. 6.1.4a, Table 6.1.4a). Majority of samples collected in 2008 contained TPHs exceeding the level of 1 MAC. In 2009, their aver¬age level slightly exceeded 1 MAC.
Table 6.1.4a. TPHs concentration (annual average — above and maximum — below in mg/1 (C*) and expressed in MAC) detected in the Northern narrowest part of the Kerch Strait at the transect of the ports of Crimea and Caucasus.
| 2001 | 2002 | 2003 | 2004 | 2005 | 2006 | 2007 | 2008 | 2009 | |||||||||
| C* | MAC | C* | MAC | C* | MAC | C* | MAC | C* | MAC | C* | MAC | C* | MAC | C* | MAC | C* | MAC |
| 0 | 0 | 0.10 | 2.0 | 0.08 | 1.6 | 0.07 | 1.4 | 0.06 | 1.2 | 0.06 | 1.2 | 0.10 | 2.0 | 0.06 | 1.2 | 0.07 | 1.4 |
| 0.07 | 1.4 | 0.29 | 5.8 | 0.25 | 5.0 | 0.23 | 4.6 | 0.24 | 4.8 | 0.29 | 5.8 | 0.24 | 4.8 | 0.31 | 6.2 | - | |
6.1.5. UA: YugNIRO. November 2007 and February, April, May 2008
Investigation on TPHs content in the UA coastal waters was conducted shortly after the Kerch oil spill, on 15th November 2007 at the site of the Kerch municipal pear. TPHs concentration was registered as 1.0 and 1.3 MAC to decrease later below 0.05 mg/1. Shortly later on 22 November it was registered again increased to 2 MAC, however, the next day again TPHs fell down to 1.5 MAC and thus continued fluctu¬ating further on at the levels typical for the Kerch Strait coastal waters. Also, heavy fractions of oil hydrocarbons had their maximum of 0.037 mg/1 on 22 November in contrast to their typical concentration of about 0.010 mg/1.
Observations close to the Tuzla Island were conducted on 21 November 2007, and they revealed a low level of hydrocarbons in the upper layer (0.024-0.025 mg/1), as well as in the near-bottom layer (0.026-0.044 mg/1). All the data showed the levels below 1 MAC to equal 0.05 mg/1 (Petrenko O.A. etal, 2008). After the oil spill ac¬cident in the Kerch Strait on 11 November 2007, petroleum pollution was registered exceeding the level revealed by the August 2007 data collected in the surface and near-bottom layers, i. e., 0.03-0.14 and 0.04-0.09 correspondingly (Zhugailo S. S. el al, 2008).
Three months later on 7 February 2008, TPHs concentration was down by 1.3 times in average. Heavy oil fractions in concentrations were decreasing faster, by 4.2 times in average.
By the end of April 2008, the level of petroleum had increased possibly in the result of secondary pollution (Fig. 6.1.5a). The maximum levels were to the north of the Tuzla Island: in surface waters — 0.128 mg/1 or 2.6 MAC and in the near-bottom waters — 0.219 mg/1 or 4.4 MAC. In comparison with the previous expedition results, the light (less-transformed) fractions concentration was registered increased by 7 times in average. One of the reasons could be the light fraction washing out from the bottom sediments. For instance, in the vicinity of Volgoneft-139 the light fractions concentration was found increased by 1.5-2.0 times in the water column, whereas it was registered reduced by two times in the bottom sediments at the sunken tanker bow site, and by almost 8 times — close to the grounded stern.

Fig. 6.1.5a. Spatial distribution of petroleum hydrocarbons in the surface (1) and near-bottom (2) layers of the Kerch Strait area on 22.04.2008.
In May 2008, the TPHs maximum concentration (0.09 mg/1 or 1.8 MAC) in the sur¬face waters was registered in the central part of the Strait, while the concentrations were recorded decreased to 0.034 mg/1 to the South.
6.1.6. UA: IBSS. 9-17 December 2007
Total petroleum hydrocarbons concentrations in the coastal waters of the Tuzla Is¬land and some other sections of the Kerch Strait were investigated by IBSS within the short period of 9-17 December 2007 (Tab. 6.1.6a). In the vicinity of the Tuzla Is¬land, TPHs level exceeded 1 MAC in 58 % of samples collected. In the period of 14- 16 December, practically all sites around the Tuzla Island showed the concentration of 1.5-4 MAC. It was probably related to heavy fuel oil arrival to the Tuzla Island coast following the Kerch Strait accident. Still after its organized collection, some oil continued remaining on the sandy beaches, while its small amounts were washed back into the sea. In all the other parts of the Kerch Strait, TPHs concentration ex¬ceeding MAC was recorded in 18% of the samples. In the Azov Sea areas nearest to the Kerch Strait, i. e., the so called Reefs Bight, the hydrocarbons content in water did not exceed the MAC value (checked on 12 December 2007).
Visual observations of December 2007 have clearly showed decrease of water pollu¬tion levels compared to the situation right after the Kerch Strait accident. However, when the concentration is below 0.15 mg/1, oil is not visible on the surface and could be detected by chemical analysis only, since it is present in the form of a fine-dis- persed emulsion. The process of oil transformation speeds up with increase in wind velocity. Oil film on the surface was registered before in the course of experiments to last 1.5-2 hours with a wind of about 10-15 m/s (Mironov O.G., 1985). High speed of oil transformation from a surface film into a water column emulsion was proved by mathematical modeling as well (Ahmetov A. Sh., 1977, BeliaevV.I., 1974). In the case of the Kerch Strait accident, visible oil slicks disappeared fast from the surface because of a stormy weather. Chemical analyses have proved the presence of elevated TPHs concentrations in December 2007. Nevertheless, TPHs concentra¬tions close to those levels were registered over the whole Azov Sea area in November
1992, while in certain sea areas TPHs were detected at the level of 20 MAC, though no accident had been reported (Mironov O G.. 2000).
Table 6.1.6a. Total petroleum hydrocarbons concentration (mg/1) in the coastal waters of the Kerch Strait on 9-17 December, 2007 (Eremeev V.N. etal., 2008).
| Site | 09 | 10 | 11 | 12 | 13 | 14 | 15 | 16 | 17 |
| The Tuzla Island, North-Western side of the pier | 0.05 | 0.07 | 0.05 | 0.11 | 0.05 | 0.08 | |||
| The Tuzla Island, Western side of the pier | 0.17 | 0.05 | 0.05 | 0.14 | 0.11 | 0.08 | |||
| The Tuzla Island, North-Western extremity | 0.05 | 0.05 | 0.05 | 0.11 | 0.08 | 0.07 | |||
| The Tuzla Island, South-Eastern extremity | 0.05 | ||||||||
| The Tuzla Island, Southern part | 0.05 | 0.05 | 0.17 | 0.19 | 0.12 | 0.08 | 0.08 | ||
| The Gleiky Village, coast line in the Light Cape vicinity | 0.07 | 0.05 | 0.05 | 0.05 | 0.05 | 0.05 | |||
| TheZukovka village, Putina Ltd. | 0.05 | 0.05 | 0.05 | 0.05 | |||||
| The Kiev holiday hotel | 0.05 | 0.08 | |||||||
| The Arshintsevkaya Spit, the Kerch municipal beach | 0.05 | 0.05 | |||||||
| The Azov Sea, the Reefs Biaht | 0.05 | ||||||||
| The Light Cape, a beach toward the Osovino village | 0.05 | ||||||||
| The Bulganak Bight, WWTP outlet | 0.05 | 0.05 | <0.05 | 0.05 | |||||
| Adam between the Tabichskoe lake and the Kerch Strait | 0.07 | ||||||||
| The Varzovskaya Biqht | 0.08 | 0.05 |
The Marine Hydro-Physical Institute of the Ukrainian National Academy of Sciences (Sevastopol) conducted in the Kerch Strait region two expeditions to study the level of water and bottom sediments petroleum hydrocarbons pollution in December 2007 and March 2008 (Fig. 6.1.7a).
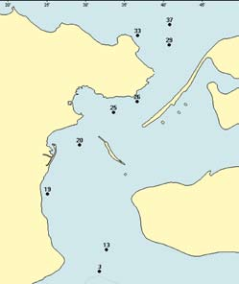
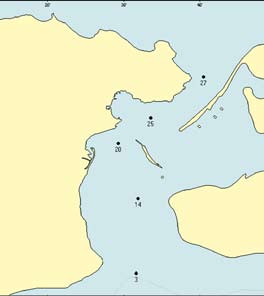
Fig. 6.1.7a. Stations for sampling water and bottom sediments in the Kerch Strait on 6–9 December 2007 and March 2008.
The TPHs upper layer concentration varied in the range below detection limit of 0.02 mg/1 to 0.09 mg/1. Above 1 MAC (0.05 mg/1) concentration was recorded at No3 station located in the Black Sea close to the Southern entrance of the Kerch Strait and the site of dredged spoils dumping. Also, close to it was located the area where transshipments from one boat to another were taking place in the Kerch Strait.
On 4 December 2009, the surface water sampling for PHs was carried out by MHI and MB UHMI at 18 stations close to the Tuzla Island (Fig. 6.1.7b). TPHs concentrations were below their detection limit of 0.05 mg/1 at all surveyed locations.
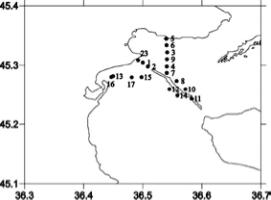
Fig. 6.1.7b. Stations for total petroleum hydrocarbons sampling of the Kerch Strait surface layer on 4 December 2009 (by MHI and MB UHMI).
During the V. Parshin RV 30th cruise, investigations of total petroleum hydro¬carbons by means of infra-red spectrophotometry (Oradovsky S. G., 1993) and aro¬matic hydrocarbons — by spectrofluorometry (Methodic Guidelines, 1993) were carried out at 14 stations on 8 July 2009 (Fig. 5.6a). Prior to that, samples were col¬lected as well at eight shelf stations in the North-Western part of the Black Sea. Sam¬pling was carried out of the surface layer only. TPHs concentration stood at 1 MAC (Tab. 6.1,8a) at all the Kerch Strait stations with the exception of one. On the contrary, at the Karkinitsky Bay North-Western shelf, TPHs content was reaching 10 MAC. The minimum level was recorded by the Crimean coast. Polyaromatic hydrocarbons were present in low concentration along the Crimean coast as well.
Table 6.1.8a. Total petroleum hydrocarbons and aromatic hydrocarbons concentrations detected in July 2009 in the surface waters of the Black Sea North-Western part and in the Kerch Strait.
| Stations | Date | Depth, m | Sampling, depth | Coordinates | TPHs | Aromatic hydrocarbons | |
| Latitude | Longitude | mg/l | MQ/I | ||||
| the Black Sea North-Western shelf | |||||||
| 4 | 1.07 | 26 | 0 | 45'47°90 | 31'22°63 | 0.05 | 12.9 |
| 5 | 1.07 | 38 | 0 | 45'39°56 | 31'36°68 | 0.57 | |
| 6 | 2.07 | 44 | 0 | 45'31 "00 | 31'41°02 | 0.26 | 10.8 |
| 7 | 2.07 | 50 | 0 | 45'14°99 | 31'37°62 | 0.08 | 15.8 |
| 98 | 2.07 | 45 | 0 | 45'24°97 | 31'21°90 | 0.13 | 27.3 |
| 99 | 2.07 | 45 | 0 | 45'25°04 | 31'13°00 | 0.09 | 12.3 |
| 100 | 2.07 | 51 | 0 | 45'15°00 | 31'20°02 | 0.05 | 12.1 |
| 96 | 2.07 | 58 | 0 | 44'56°96 | 31'29°47 | 0.02 | 15.2 |
| the Kerch Strait | |||||||
| 55k | 8.07 | 4.6 | 0 | 45'17°95 | 36'29°26 | 0.05 | 33.1 |
| 54k | 8.07 | 5 | 0 | 45'17°77 | 36'29°28 | 12.8 | |
| 49k | 8.07 | 5 | 0 | 45'14°95 | 36'29°26 | 0.05 | 24.2 |
| 47k | 8.07 | 6 | 0 | 45'14°12 | 36'30°75 | 10.6 | |
| 40k | 8.07 | 7 | 0 | 45'11°08 | 36'25°42 | <0.02 | 28.8 |
| 41k | 8.07 | 6 | 0 | 45'11°21 | 36'26°57 | 0.05 | 29.2 |
| 39k | 8.07 | 18 | 0 | 45'09°21 | 36'27°05 | 0.05 | |
| 44k | 8.07 | 9 | 0 | 45'11°82 | 36'30°63 | 0.05 | 21.2 |
In December 2009, during the 31st Vlctdymyr Parshin RV cruise samples were collect¬ed in the Kerch Strait surface and near-bottom waters. In both layers and almost at all stations TPHs concentration exceeded the level of 1 MAC (Fig. 6.1.8a). In the sur¬face waters, a visible patch of high TPHs concentration was registered at the Black Sea entrance to the Kerch Strait (transshipment and anchoring area, where crude oil or oil products were pumped from one ship to another). Higher TPHs levels were also detected in the area westward of the Tuzla Island and in the Strait Northern part by the Chushka Spit. In general, petroleum hydrocarbons content was substantially higher in the near-bottom waters. In the Kerch Strait Northern and Western sections the TPHs distribution patterns were nearly identical in the surface and bottom waters. Quite the opposite, no patch of high TPHs levels near bottom resulting from the high¬er concentration on the surface was found in its Southern part.
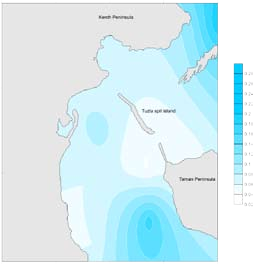

Fig. 6.1.8a. Spatial distribution of total petroleum hydrocarbons (mg/1) in the surface (a) and near-bot- tom layers in December 2009, the Vladymyr Parshin RV 31a cruise
In addition to the infra-red methods applied for TPHs registration, spectrophlyorimet- ric methods for polycyclic aromatic hydrocarbons detection (PAHs) were employed for analysis of the same water samples. Aromatic oil fractions were widely distributed in the Kerch Strait waters and their concentration was reaching the level of 7 |ig/l. Their spatial distribution was quite similar to the TPHs presence in the surface layer (Fig. 6.1.8b).
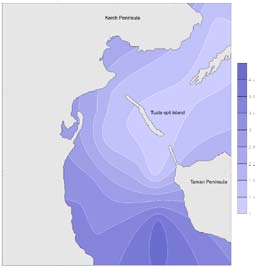
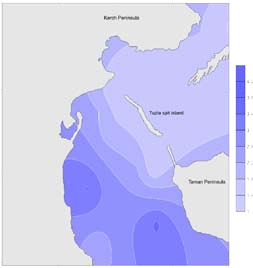
Fig. 6.1.8b. Spatial distribution of aromatic hydrocarbons (mg / l) in the surface (a) and near-bottom layersinDecember2009, theVladymyrParshinRV31st cruise.
6.1.9. Petroleum hydrocarbons inter-seas exchanges in 2008-2009
The available monitoring data have allowed to determine TPHs exchanges between the Azov and Black Seas through analyzing measured concentrations and calculated water flows (Chapter 5).
Calculations of the water flows and TPHs concentration have revealed high pres¬ence of petroleum hydrocarbons in the Azov Sea resulting from the inflow of about 20-660 g/s of TPHs in April-September 2008. However, the opposite flow was regis¬tered from October 2008 till May 2009 to result in about 85-300 g/s of TPHs arriving to the Black Sea (Fig. 6.1,9a).

Fig. 6.1.9a. Petroleum hydrocarbons exchanges between the Azov and Black Seas in 2008-2009.
6.1.10. RU: Kuban HMS. Monitoring of the Russian waters in 2007-2009
The sea water samples were collected in the surface and near-bottom coastal waters of the Kerch Strait Russian section by the Kuban Estuarine Hydrometeorological Station (KEHMS, its former name was the Kuban Estuarine Station, KES, the town of Tem- ruk) of the Krasnodar Center of Hydrometeorological Service state department under Roshydromet. Petroleum hydrocarbons concentration was determined by means of in¬frared spectrophotometry (Oradovsky S. G., 1993). During the period of 13 November 2007-29 June 2009, 617 samples were collected at 77 stations in the surface waters and 46 samples at 22 stations — in the near-bottom waters (Fig. 6.1.10a). A number of samples were also collected along the Russian coast near the Arkhipo-Osipovka, Divnomorskoe, Kabardinka and Abrau-Durso settlements at the stations located far to the South from the Kerch Strait.

Fig. 6.1.10a. Location of sampling stations: The Russian Roshydromet monitoring program, 13 Novem¬ber 2007-29 June 2009.
During the period of observation, the surface layer regular sampling (two times per month) was carried out at 14 stations out of total 77 only (Fig. 6.1.10b). Generally, monitoring was conducted most regularly at the littoral stations of the Temruk Bay. Still, periodical sampling at the littoral stations located in the Northern and Southern parts of the Tuzla Island and in the Southern part of the Taman Peninsula was carried out as well. Regular sampling and measurement of petroleum hydrocarbons presence in the bottom layers of the Temruk harbor were performed twice at the shipwreck site in the Kerch Strait and close to the Taman village on 28 November and 12 December 2007 respectively.
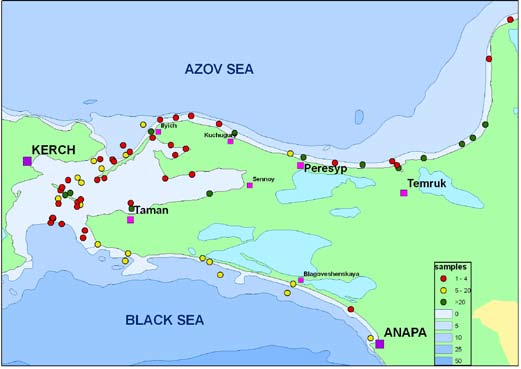
Fig. 6.1.10b. Frequency of the surface layer water sampling on 13 November 2007-29 June 2009.
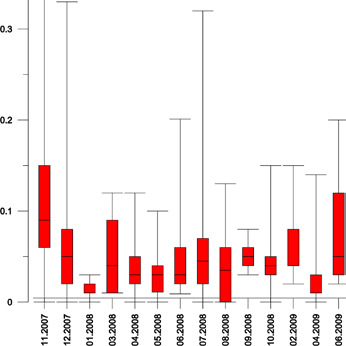
Fig. 6.1.10c. Average monthly presence of petroleum hydrocarbons (mg/1) in the Kerch Strait waters as observed on 13 November 2007-3 June 2009. Two maximal values 2.500 mg/1 and 1.736 mg/1 inNo- vember 2007 are not presented at the figure. The box-whisker plot graph displays the minimum, maxi¬mum, median, lower quartile, and upper quartile for TPHs.
Time dynamics of petroleum pollution: During the observation period of one and a half years (November 2007-June 2009), the highest petroleum hydrocarbons pres¬ence level was observed during the first several days after the Kerch Strait accident. It averaged 1.1 mg/1 (23 MAC) on 13-16 November 2007. The maximum concentra¬tions of 2.5 mg/1 (50 MAC) and 1.74 mg/1 (34.7 MAC) were recorded at the shore¬lines of the Chushka Spit (4 km to the North-East from the port of Caucasus) and of the port of Caucasus respectively.
In the second half ofNovember 2007 sampling was carried out daily. In 24 samples col-lected on 17-28 November 2007, the TPHs concentration level stood at 0-0.290 mg/1 averaging 0.092 (1.8 MAC). Its highest was recorded in the waters close to the Tuzla Spit. In December 2007, 100 samples were collected in the course of three campaigns and the maximum registered level was 0.330 mg/1 (6.6 MAC) recorded on 1 Decem¬ber nearby the Ilyich village. The minimum of 0.001mg/l (0.02 MAC) was observed nearby the port of Temruk and close to the Tuzla Island (from the Taman Bay side) and its average in December was 0.060 mg/1 (1.2 MAC). Results obtained in 2007- 2009 are presented in Table 6.1.10a.
Table 6.1.10a. TPHs (mg/1) presence in the surface layers: Ranges of variation, averages and areas of maximal concentration, 2007-2009
| 2007 | 2008 | 2009 | ||||||||||||
| Month | 11 | 12 | 01 | 03 | 04 | 05 | 06 | 07 | 08 | 09 | 10 | 02 | 04 | 06 |
| Range | 0-2,500 | 0-0.330 | 0-0.030 | 0.010- 0.120 | 0- 0.120 | 0- 0.100 | 0.009- 0.201 | 0-0.320 | 0-0.130 | 0.030- 0.080 | 0-0.150 | 0.020- 0.150 | 0-0.140 | 0.020- 0.200 |
| Average | 0.150 | 0.060 | 0.014 | 0.051 | 0.034 | 0.032 | 0.042 | 0.051 | 0.036 | 0.050 | 0.044 | 0.061 | 0.023 | 0.074 |
| Average in MAC | 3.0 | 1.2 | 0.3 | 1.0 | 0.7 | 0.6 | 0.8 | 1.0 | 0.7 | 1.0 | 0.9 | 1.2 | 0.5 | 1.5 |
| Max values at: | the Chushka Spit, the Port of Caucasus | the Ilyich village | the Port of Temruk, the Tuzla Spit, the Taman Bay | the Port of Caucasus, the Ilyich village | the Taman village | the Ilyich village | the Tuzla Spit | the Beregovoy village (the Dinsky Bay) | Shipwreck near the Tuzla Island | the Perekopka village in the Temruk Bay | the Perekopka village, the Tuzla Spit | the Panagiya Cape | the Temruk port | the Ilyich village |
Spatial variability: average TPHs concentration at different sites. Monthly aver¬age of TPHs concentration varied significantly at different sites along the coasts of the Kerch Strait and in the Azov Sea (Table 6.1.10b). The most frequent excess of TPHs (ranging 1.5-3 MAC) was observed in 2008-2009 close to the Taman village and the Tuzla Island from the Black Sea side, as well as nearby the Ilyich village and the Port of Caucasus. Concentrations of TPHs lower than 1 MAC were recorded in 220 samples (one third of all samples).
In the near-bottom layer, TPHs concentrations varied from 0.01 mg/1 (0.2 MAC) to 0.18 mg/1 (3.6 MAC) averaging 0.07 mg/1 (1.5 MAC). On 28 November 2007, the maximum of 0.18 mg/1 was observed by the Taman village and 2 km to the North, and the minimum concentration of 0.06 mg/1 was registered at the head of the sunken tanker. Later, on 18 December 2007 the maximum TPHs concentration of 0.06 mg/1 (1.2 MAC) was observed in front of the Panagia Cape close to the Tamansky trans¬shipment site, while the minimum of 0.02 mg/1 (0.4 MAC) was recorded by the Port of Caucasus.
Table 6.1.10b. Average TPHs (in MAC) presence in November 2007-June 2009 as observed in the Kerch Strait surface layer at 16 stations.
| Site and number of samples | 2007 | 2008 | 2009 | |||||||||||
| Month | 11 | 12 | 01 | 03 | 04 | 05 | 06 | 07 | 08 | 09 | 10 | 02 | 04 | 06 |
| the llyich villaqe/30 | 5.2 | 2.7 | 0.3 | 2.4 | 1.0 | 1.6 | 1.1 | 1.6 | 0.8 | 1.3 | 0.8 | 1.2 | 1.2 | 4.0 |
| the Cuchuqury villaqe/30 | 3.6 | 2.1 | 0.3 | 1.4 | 1.4 | 0.9 | 0.9 | 1.5 | 0.1 | 1.2 | 0.5 | 1.0 | 0.6 | 1.2 |
| the Temruk port/30 | 1.5 | 0.3 | 0.1 | 0.4 | 0.8 | 0.7 | 1.5 | 1.1 | 1.4 | 1.0 | 0.7 | 0.6 | 2.8 | 0.6 |
| the Golubitskaya villaqe/30 | 1.0 | 1.0 | 0.3 | 0.4 | 0.6 | 0.7 | 0.9 | 1.2 | 1.5 | 0.7 | 0.5 | 0.8 | 0.4 | 0.8 |
| the Port of Caucasus/29 | 7.1 | 2.1 | 0.2 | 2.4 | 0.8 | 1.0 | 1.3 | 1.3 | 0.9 | 1.0 | 1.1 | 2.4 | 0.2 | 2.4 |
| Solovievskoe Girlo/29 | 1.4 | 1.2 | 0.3 | 0.2 | 0.6 | 0.8 | 0.8 | 0.7 | 1.2 | 0.8 | 0.6 | 0.8 | 0.2 | 0.8 |
| Kulikovskoe Girlo/29 | 1.4 | 1.0 | 0.2 | 0.2 | 0.8 | 0.7 | 0.6 | 0.9 | 1.1 | 0.8 | 0.9 | 0.8 | 0.0 | 0.6 |
| the Perekopka villaqe/29 | 1.6 | 0.9 | 0.2 | 0.2 | 0.6 | 0.6 | 0.5 | 0.5 | 1.1 | 0.8 | 0.8 | 0.6 | 0.0 | 0.6 |
| Zozulievskoe Girlo/28 | 1.3 | 0.8 | 0.2 | 0.2 | 0.4 | 0.4 | 0.5 | 0.5 | 0.9 | 0.8 | 0.6 | 0.6 | 0.2 | 0.6 |
| the Taman villaqe/27 | 2.6 | 2.1 | 0.5 | 1.8 | 2.4 | 1.3 | 1.2 | 1.2 | 0.9 | 1.0 | 1.0 | 2.6 | 0.6 | 1.8 |
| the Peresyp villaqe/26 | 1.7 | 1.5 | 0.1 | 1.2 | 1.0 | 0.8 | 1.0 | 1.2 | 0.5 | 1.5 | 1.9 | 0.8 | 0.2 | 0.6 |
| the Primorsky villaqe/26 | 1.5 | 1.2 | 0.5 | 0.8 | 1.0 | 0.7 | 1.1 | 1.8 | 1.3 | 1.0 | 0.2 | 1.6 | 0.4 | 1.0 |
| the Tuzla Spit (the Black Sea side)/25 | 3.0 | 2.0 | 0.5 | 1.4 | 0.6 | 0.5 | 0.8 | 1.6 | 0.5 | 1.2 | 1.9 | 1.4 | 0.0 | 2.4 |
| the Tuzla Spit (the Azov Sea side)/25 | 1.8 | 1.5 | 0.2 | 1.8 | 1.0 | 1.0 | 0.9 | 1.7 | 0.6 | 1.0 | 0.6 | 1.4 | 0.4 | 3.4 |
| the Panaqia Cape/17 | 4.2 | 0.6 | 0.4 | - | 1.2 | 0.9 | 0.5 | 1.8 | - | 0.0 | 0.7 | 3.0 | 0.4 | 3.0 |
| the Bugazskaya Spit, the Western end/11 | - | 1.0 | 0.0 | - | 1.0 | 0.6 | 0.5 | 0.8 | ||||||

Fig. 6.1.10d. Zoning of the Kerch Strait and adjacent littorals of the Black and the Azov Seas: I — littoralof the Black Sea from the Kerch Strait till the Arhipo-Osipovka village; II — the Kerch Strait Southernpart (from the Tuzla Island to the Iron Horn Cape); III — the Kerch Strait central part (the water area ofthe Port of Caucasus); IV — the Kerch Strait Northern part (from the Port of Caucasus till the AhilleonCape); V — the Taman Bay; VI — the Dinsky Bay; VII — the Temruk Bay; VIII — the Azov Sea.
In order to determine dynamics of TPHs concentration of varying impact level, the Russian waters of the Azov and Black Seas jointly with the Kerch Strait up to the fairway were divided into 8 sections bearing in mind the baseline level of pol¬lution and the trajectory of oil spilled during the Kerch Strait accident (Fig. 6.1.10d). Each of those zones had its own natural peculiarities of hydrological regime and water currents that were largely determined by their natural geo-formations being the is¬lands, capes or spits.
Before 2007 and later, samples were occasionally collected in the Dinsky Bay and on the Azov Sea littoral to the North from the Temruk Bay. Therefore, no enough data to assess TPHs dynamics in the areas VI and VIII were present (Fig. 6.1.10d). At least 43 samples were collected in every of the rest of the areas (Fig. 6.1. lOd). For example, the Temruk Bay was sampled 269 times (Table 6.1.10c) since the Kerch Strait accident.
Table 6.1.10c. The number of samples collected by the Kuban EHMS at various sites of the Kerch Strait, the Azov and Black Seas in November 2008 — June 2009. TPHs content is presented as range of concen¬tration and is given in mg/1 and MAC, and the same is valid for the average parameters
| N | Location | Zone | The number of samples collected | Range: Min/Max | Average |
| 1 | The Black Sea littoral till the Arhipo-Osipovka villaqe | I | 57 | <0.02-0.80 (16 MAC) | 0.04(0.09 MAC) |
| 2 | The Kerch Strait Southern part (from the Tuzla Island till the Iron Horn Cape) | II | 84 | <0.02-0.34(6.9 MAC) | 0.07 (1.4 MAC) |
| 3 | The Kerch Strait Central part (the water area of the Port of Caucasus) | III | 86 | <0.19-1.7 (34 MAC, 13.11.2007) | 0.07 (1.4 MAC) |
| 4 | The Kerch Strait Northern part (from the Port of Caucasus till the Ahilleon Cape) | IV | 43 | 0.004(0.08 MAC) —2.5 (50 MAC, 13 November 2007) | 0.15(3 MAC) |
| 5 | The Taman Bay | V | 61 | 0.18(3.6 MAC, 17 November 2007) | 0.06(1.2 MAC) |
| 6 | The Dinsky Bay | VI | 11 | ||
| 7 | The Temruk Bay | VII | 269 | 0.64 mg/l (13 MAC, 15 November, 2007 | 0.05(1 MAC) |
| 8 | The Azov Sea | VIII | 6 |
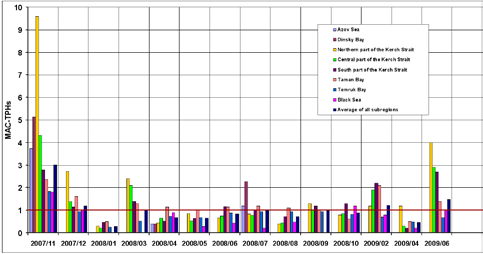
Fig. 6.1.10e. Seasonal dynamics of TPHs content (in MAC) in different zones of the Kerch Strait area in November 2007-June 2009.
The TPHs content seasonal dynamics in the Kerch Strait have demonstrated that pollu¬tion level was high during a short period of two months after the Kerch Strait accident including its extreme levels in the first few days (Fig 6.1. lOe). After that a substantial decrease of the Kerch Strait pollution level was recorded to vary within 1-2 MAC. The Kerch waters rather high TPHs content could be taken for the area as baseline pa¬rameter independent from the accident and oil spilled by Volgoneft-139 in November 2007. In general, presence of other, relatively constant, TPHs sources in the Kerch Strait were possible: illegal discharges from the vessels, oil spills to occur while bun¬kering, as well as industrial, municipal, and storm discharges, etc. In the past, accord¬ing to the monitoring data collected in the Kerch Strait Russian section, the TPHs av¬erage content was quite high reaching 0.073 mg/1 (1.5 MAC) (Korshenko A.N. etal., 2008). It is more likely that TPHs concentrations increased to up to 2 MAC in March 2008 and particularly in February 2009 were caused by other than related to the Kerch Strait 2007accident factors.
Conclusions of the Roshydromet monitoring results
Analyses of monitoring data collected in the Kerch Strait area since November 2007 have resulted in the following conclusions: High levels of TPHs pollution were re¬corded practically in all the waters surveyed during a short period of two months im¬mediately after the Kerch accident. Later, the level of pollution decreased significant¬ly to reach the baseline concentrations of 1-2 MAC. It is likely that other constant sources of TPHs pollution were present in the area, such as illegal discharges from the vessels, oil spills to occur while bunkering, as well as industrial, municipal, and storm discharges, etc.
Sampling of bottom sediments and benthic communities is essential for determining their contamination level, since they are the environmental 'memory' to record the chemical pollution negative impacts. The Roshydromet monitoring program lacked a biological component. Those gaps in observations impeded assessment of the long term petroleum impact on environment of the Black and Azov Seas, including the Kerch Strait.
The Roshydromet monitoring program was not adapted to comprehensively study the short-term impact of an accident. It was rather focused on the long term permanent observations at specifically selected stations. As a result, irregular sampling only was carried out after the Kerch Strait accident in the areas of interest, and only part of pol¬luted waters was studied, while very few surveys of the bottom waters (usually heavier polluted by hydrocarbons) were carried out. Besides, historical data on pollution of the Kerch Strait waters and its sediments were scarce due to the absence of regular ob¬servations in that particular area (Korshenko A. N, Panova A. I., 2009, 2009a).
6.1.11. RU: VNIRO. July 2008: The Kerch Strait and the Taman Bay
In July 2008, a complex oceanological expedition was conducted in the Kerch Strait and the Taman Bay, and it was organized by the All-Russian Fishery Institute (VNIRO, Moscow). In its course, hydrological and hydrochemical parameters were measured, and presence of petroleum and other chemical contaminants in the waters and bottom sediments was studied, while samples were collected at 38 stations (Fig. 6.1.11a). In the bottom layers at two stations (31st and 32nd, inner part of the Taman Bay at depth 5 m) the presence of heavy oil, probably related to the spillage from the Vol- goneft-139 tanker, was registered. At all other stations, neither in water nor in bottom sediments any petroleum was found.

Fig. 6.1.11a. Sampling stations of the VNIRO (Moscow) expedition in July 2008.
Petroleum hydrocarbons spatial variability on 24 July 2008
Petroleum hydrocarbons content varied from analytical zero to 1.635 mg/1 (32.7 MAC) with the average of 0.046 mg/1 (0.92 MAC). Also, 107 TPHs samples (64%) taken had the concentration exceeding the analytical detection limit of 0.005 mg/1. Vertically, concentrations were unevenly distributed and were higher at the surface (Table 6.1.12a). The surface waters concentrations significantly differed from those in the bottom layer. In the surface waters two patches having a very high level of TPHs presence (about 33 MAC) were registered inside the Taman Bay area and at one of the North-Eastern stations near the Chushka Spit (Fig. 6.1.12a). Waters of the bottom layers were rather clean, and TPHs concentration near the Chushka Spit and inside the Taman Bay stood at 1 MAC. Up to 27 MAC concentrations were re¬corded in the Southern part of the Kerch Strait only. Petroleum hydrocarbons content varied from analytical zero to 1.635 mg/1 (32.7 MAC) with the average of 0.046 mg/1 (0.92 MAC). Also, 107 TPHs samples (64%) taken had the concentration exceeding the analytical detection limit of 0.005 mg/1. Vertically, concentrations were unevenly distributed and were higher at the sur¬face (Table 6.1.12a). The surface waters concentrations significantly differed from those in the bottom layer. In the surface waters two patches having a very high level of TPHs presence (about 33 MAC) were registered inside the Taman Bay area and at one of the North-Eastern stations near the Chushka Spit (Fig. 6.1.12a). Waters of the bottom layers were rather clean, and TPHs concentration near the Chushka Spit and inside the Taman Bay stood at 1 MAC. Up to 27 MAC concentrations were re¬corded in the Southern part of the Kerch Strait only.
Table 6.1.12a. Concentration of petroleum hydrocarbons (mg/1) in the surface and bottom waters of the Kerch Strait on 24 July 2008
| Layer | Range | Average | Impacted areas (from 1 to 33 MAC) |
| Surface | 0-1.635 mg/l | 0.097 mg/l (1.9 MAC) | The Taman Bay, the Chushka Spit Northern part |
| Bottom | 0-1.345 mg/l | 0.052 mg/l (1.0 MAC) | The Kerch Strait-Black Sea Southern part |
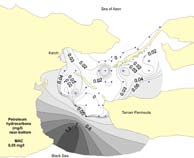
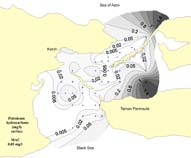
Fig. 6.1.12a. Total petroleum hydrocarbons concentration (mg/1) in the surface and near-bottom waters of the Kerch Strait on 24 July, 2008
In August 2008, high TPHs concentration (3.2 MAC) was detected around the Tuz- la Island, however levels at analytical zeros or close to 0.5 MAC were registered at the nearby stations (Table 6.1.12b, Fig. 6.1.12b). Vertically, TPHs distribution was rather even. Patches of relatively high TPHs concentrations (above 0.2 MAC) were de¬tected in the Northern narrowness of the Kerch Strait and were most probably resulting from the land based sources. Average for the whole water column stood at 0.021 mg/1.
Table 6.1.12b. Concentration of petroleum hydrocarbons (mg/1) in the surface and bottom waters of the Kerch Strait on 31 August 2008.
| Layer | Range | Average | Impacted areas (from 1 to 3 MAC) |
| Surface | 0-0.160 mg/l | 0.022 mg/l (0.4 MAC) | The Tuzla Island |
| Bottom | 0-0.074 mg/l | 0.021 mg/l (0.4 MAC) | Area between the Kerch port and the Port of Caucasus, Chushka Spit |
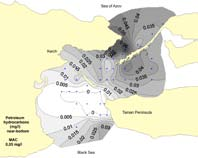

Fig. 6.1.12b. Total petroleum hydrocarbons concentration (mg/1) in the surface and near-bottom waters of the Kerch Strait on 31 August, 2008.
In autumn, 150 samples were collected and all of them had high petroleum content exceeding the analytical detection limit of 0.0005 mg/1. Concentration varied from 0.0024 mg/1 to 0.094 mg/1 (0.021 mg/1 in average). Levels exceeding MAC were registered in 9.3 % of all samples. TPHs concentrations of a baseline level were rather common for the area, while patchiness was more actively expressed in the bottom layers and a relatively high TPHs content was detected offshore the Panagia Cape, westward of the Tuzla Island, and in the Azov Sea (Table 6.1.12c, Fig. 6.1.12c).
Table 6.1.12c. Concentration of petroleum hydrocarbons (mg/1) in the surface and bottom waters of the Kerch Strait in November 2008.
| Layer | Range | Average | Impacted areas (from 1 to 2 MAC) |
| Surface | 0.004-0.094 | 0.019 mg/l (0.4 MAC) | the Northern narrowness |
| Bottom | 0.002-0.070 | 0.024 mg/l (0.4 MAC) | offshore the Panagia Cape, the Tuzla Island and the Azov Sea |
In autumn, 150 samples were collected and all of them had high petroleum content exceeding the analytical detection limit of 0.0005 mg/1. Concentration varied from 0.0024 mg/1 to 0.094 mg/1 (0.021 mg/1 in average). Levels exceeding MAC were registered in 9.3 % of all samples. TPHs concentrations of a baseline level were rather common for the area, while patchiness was more actively expressed in the bottom layers and a relatively high TPHs content was detected offshore the Panagia Cape, westward of the Tuzla Island, and in the Azov Sea (Table 6.1.12c, Fig. 6.1.12c).
Table 6.1.12c. Concentration of petroleum hydrocarbons (mg/1) in the surface and bottom waters of the Kerch Strait in November 2008
| Layer | Range | Average | Impacted areas (from 1 to 2 MAC) |
| Surface | 0.004-0.094 | 0.019 mg/l (0.4 MAC) | the Northern narrowness |
| Bottom | 0.002-0.070 | 0.024 mg/l (0.4 MAC) | offshore the Panagia Cape, the Tuzla Island and the Azov Sea |
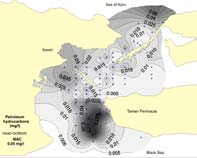
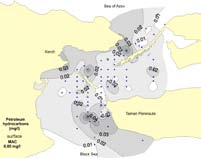
Fig. 6.1.12c. Total petroleum hydrocarbons concentration (mg/1) in the surface and near-bottom layers of the Kerch Strait on 6-15 November 2008
TPHs concentrations exceeded 1 MAC in 23 % of all samples collected. The maxi¬mum concentration observed (1.1 mg/1) was reaching 22 MAC in the surface layers. Patchiness differed at the surface and at the bottom, while vertically TPHs distribu¬tion was uneven. (Table 6.1.12d, Fig. 6.1.12d).
Table 6.1.12d. Concentration of petroleum hydrocarbons (mg/1) in the surface and bottom waters of the Kerch Strait in December 2008.
| Layer | Range | Average | Impacted areas (from 1 to 22 MAC) |
| Surface | 0.006-1.100 | 0.098(2.0 MAC) | the Kerch Strait Southern part |
| Bottom | 0.006-0.269 | 0.034 mg/l (0.7 MAC) | the Kerch Strait Southern part |

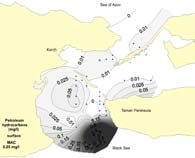
Fig. 6.1.12d. Total petroleum hydrocarbons concentration (mg/1) in the surface and near-bottom layers of the Kerch Strait in December 2008
6.1.13. Summary: Presence of petroleum hydrocarbons in the water
The TPHs average concentration was quite stable and stood at the levels around 1.0 MAC (0.05 mg/l). It was demonstrated by the summary table of TPHs measurement data (Table 6.1.13a) obtained in the course of various expeditions organized in the framework of the Ukrainian routine monitoring program and in the result of the Roshydromet observations, as well as by all the mentioned above results of surveys over the Kerch Strait after the Kerch accident. Besides, the maximum concentration could significantly vary to occasionally exceed the High Level (HL) of pollution (1.5 mg/l) and even the Extremely High Level (EHL) of pollution (more than 2.5 mg/l), (Koshenko A. N. et al., 2009). Such a strong variability has resulted out of TPHs patchy distribution both on the surface and in the water column.
The value of average concentrations observed has signaled that the Kerch Strait wa¬ters were kept chronically polluted by petroleum hydrocarbons during the last three decades, as well as during the two years to evolve after the Kerch Strait accident.
Low efficiency of existing monitoring systems became obvious when, in case of an accident, the probability to spot a drifting oil spill by means of fixed stations proved to be minimal. Routine observations make sense for trends assessment, but should be supplemented by samplings at the possible sources of contamination sites, i. e. along the routes of vessels, at the ports, close to the vessels at bunkering, in the areas of dredging and dumping, in transshipment areas, etc. Any method of remote observa¬tion could be extremely important and highly recommended in addition.
Table 6.1.13a. Total petroleum hydrocarbons concentrations (mg/l) in the Kerch Strait area marine waters.
| No | Period | Minimum | Maximum | Average | Position of the maximum patch | Expedition, organization |
| USSR/ UA | 1981-2007, USSR and Ukrainian Monitoring Data | 2.96(59 MAC), October 1982 | the Kerch Strait, transect of the Crimea port and the Port of Caucasus | MB UHMI | ||
| UA | 1992-2000, the Kerch Bight Monitoring | - | - | 0.010.13 | the Kerch Bight | YugNIRO |
| UA | 2000-2007, the Kerch Bight Monitoring | - | - | 0.040.28 | the Kerch Bight | YugNIRO |
| UA | 2007-2009, Ukrainian Monitoring Data | 0.000 | 0.31(6.2 MAC) | - | 12 August 2008, close to the Port of Caucasus | MB UHMI |
| UA | 21 November 2007 | 0.024 | 0.044 (0.9 MAC) | - | the Tuzla Island | YugNIRO |
| UA | 9-17 December 2007 | <0.05 | 0.019 (3.8 MAC) | - | the Tuzla Island | IBSS |
| UA | 7 February 2007 | - | ~0.034 (0.7 MAC) | - | the Kerch Strait | YugNIRO |
| UA | End April 2007 | - | 0.219 (4.4 MAC) | - | the Kerch Strait | YugNIRO |
| UA | May April 2007 | 0.034 | 0.09(1.8 MAC) | - | the Kerch Strait | YugNIRO |
| UA | 15-22 November 2007 | ~0.04 | 0.10(2.0 MAC) | - | the Kerch Bight, | YugNIRO |
| RU | 13.11.2007-03.06.2009, Russian Monitoring Data | 0.000 | 2.50 (50 MAC) | 0.067 | 13 November 2007, the Chushka Spit | Kuban Estua- rine Station |
| RU | July 2008 | 0.000 | + | - | Entire part of the Taman Bay | VNIRO |
| RU | July 2008 | 0.000 | 1.635 (33 MAC) | 0.046 | Entire part of the Taman Bay | RosPrirod- Nadzor |
| RU | November 2008 | 0.002 | 0.094 (1.9 MAC) | 0.021 | the Black Sea | RosPrirod- Nadzor |
| RU | December 2008 | 0.006 | 1.100 (22 MAC) | 0.066 | the Black Sea | RosPrirod- Nadzor |
| UA | 8 July 2009 | 0.02< | 0.05 (1 MAC) | 0.05 | the Kerch Strait | UkrSCES |
| UA | December 2009 | 0.05< | 0.05< | 0.05< | Nearby the Tuzla Island | MHI and MB UHMI |
Subchapter 6.2. Bottom sediments
Petrenko O., Ilyin Yu., Fashchuk D., Flint M., Spiridonov V, Makarov A., Kolyuch- kina G., Shapovalova E., Simakova U., Sapozhnikov F., Kozlovsky V., Peresypkin V., Belyaev N., Khlebopashev P., Chasovnikov V., Nasurov A., Gogitidze T., Korshenko A., Ermakov V., Komorin V., Denga Yu., Orlova I., Kochetkov A., Ivanov D., Mironov O., Alyomov S., Zhugailo S.
6.2.1. Historical data
6.2.2. UA: YugNIRO. November 2007 and February, April, May, Septem¬ber, 0ctober2008 and June 2009
6.2.3. UA: MHI. December 2007 and March 2008
6.2.4. UA: IBSS. December 2007 and March 2008
6.2.5. RU: The Shirshov IO RAS. February-March, July 2008
6.2.6. UNEP Expedition: July 2008
6.2.7. RU: ChAD. July, August, November and December 2008
6.2.8. UA: UkrSCES. July 2009 (30th cruise of the Vladymyr Parshin RV)
6.2.9. UA: UkrSCES. December 2009 (31st cruise of the Vladymyr Parshin RV)
6.2.10. Summary: Bottom Sediments Pollution by TPHs
Trace of the long-present petroleum hydrocarbons marine environment pollution is relatively easier detected in the sea bottom sediments than in the highly dynamic water masses. Of course, any pollutant brought by gravitational sinking to the sea bottom — depending on various factors — undergoes destruction or conservation processes. Yet, various pollutants presence in the bottom sediments, impartially of the level of their decomposition, reflects a long-time anthropogenic pressure on the marine environment. This chapter gives a brief overview of the TPHs historical presence in the sediments as well as of investigation results of the Kerch Strait ac¬cident impact on the sediments quality.
Prior to the Kerch Strait accident on 11 November 2007, sampling of the Kerch Strait bottom sediments for identification of petroleum hydrocarbons presence were carried out on an occasional basis. In November 2003 the maximum concentration of TPHs in the Central part of the Strait exceeded 1,090 (ig/g (22 PC ), while the average was 490 (ig/g (see Fig. 6.2.10a). Later expeditions were organized by YugNIRO on 22 October 2005 and, shortly prior to the accident, on 18 October 2007. Their investigation results revealed the presence of the Kerch Strait petroleum pollution ranging from moderate to high levels (Fig. 6.2.1a), (Petrenko O.A., Zhugailo S.S., AvdeevaT.M., 2008). Both studies deter-mined the heavy oil fraction average presence of about 90-170 (ig/g, while the TPHs range of presence was recorded as 300-400 (ig/g, e. g., 6-8 PC. For both parameters, the maxima were nearly two times higher, e.g., for the heavy oil fractions, the maximum was reaching 400 (ig/g on 22 October 2005, and 175 (ig/g on 18 October 2007; the TPHs maximal values were cor¬respondingly about 750 ng/g on 22 October 2005 and 500 ng/g on 18 October 2007.
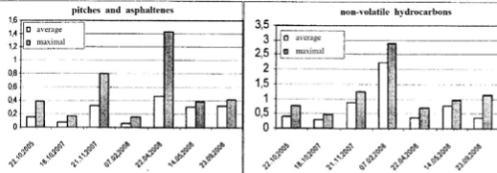
Fig. 6.2.1a. Concentrations variability (mg/g) of pitches and asphaltenes measured by UV-spectrometry (left) and of total petroleum hydrocarbons measured by IR-spectrometry (right) in the Kerch Strait bottom sediments (Petrenko O. A., Zhugailo S. S., Avdeeva T. M., 2008) in the period of October 2005-September 2008.
Under the Russian monitoring program, on 15 October 2004 a single sample was collected in the port of Caucasus that had TPHs concentration of about 59.5 μg / g (1.2 PC) (Korshenko A. et al., 2009, Korshenko A., 2008). The same sample has revealed the subtotal of polycyclic aromatic hydrocarbons (PAHs) reaching 1,011.10 ng / g that slightly exceeded the PC level of 1,000 ng / g.
6.2.2. UA: YugNIRO. November 2007 and February, April, May, Septem¬ber, October 2008 and June 2009
Few days after the 11 November 2007 accident, YugNIRO carried out comprehensive studies of petroleum hydrocarbons distribution in the Kerch Strait bottom sediments (Fig. 6.2.2a). The data made available revealed the maximum of total petroleum hydrocarbons concentration in the bottom sediments reaching very high level of 2,024 μg / g of dry weight (equal to 40.5 PC) in the vicinity of the Volgoneft-139 sunken bow (Fig. 6.2.1a, 6.2.2a). Slightly lower concentration of 1,897 μg / g was detected near the Nahichevan cargo boat and of 1,393 μg / g — at buoy No 27 (to the north of the Temruk Island). Other investigated areas were found less polluted by petroleum hydrocarbons whose levels varied in the range of 493–1,000 μg / g reaching the aver age of about 1,250 μg / g (Petrenko O. A., 2008; Zhugailo S. S., 2008; Petrenko O. A., Zhugailo S. S., Avdeeva T. M., 2008; Petrenko O. A. et al., 2008).

Fig. 6.2.2a. Map of the area investigated by YugNIRO in November 2007 and February 2008
Less transformed fractions of petroleum hydrocarbons were found dominating in the bottom sediments (61 %-93 % of the PHs total weight). Strongly transformed fractions of bitumens and asphaltenes were found reaching maximal concentrations of 795 (ig/g and 684 |ig/g correspondingly near the sunken Nahichevan boat and the Vol- goneft-139 bow part.
Further investigations carried out on 7 February 2008 revealed an increase of pe¬troleum hydrocarbons presence near the Volgoneft-139 grounded stern reaching up to 2,988 (ig/g and in the vicinity of buoy No 27 — up to 2,406 |ig/g. Concentrations measured around the Volgoneft-139 sunken bow were found decreased to 1,225 |ig/g. The petroleum hydrocarbons heavy fractions share was detected significantly de¬creased to the level of 2 %-4 % of total weight only. The latter fractions were found mainly concentrated in the Southern part of the transshipment area. In February 2008, the spatial distribution of total petroleum hydrocarbons and oil light fractions was generally uneven in the Kerch Strait demonstrating their decrease from the North to the South. However, the TPHs average level was detected very high reaching about 2,250 ng/g.
On 22 April 2008, concentration of bitumens and asphaltenes was found increasing si-multaneously with the light fractions decrease due to their washing out from the bot- torn sediments. TPHs presence averaged around 820 |ig/g reaching 1,780 |ig/g at a single station. The light fractions sediments concentration dropped down two times in the Volgoneft-139 bow part vicinity and about eight times — by the grounded tank¬er stern. The maximum heavy fractions concentration was detected in the Northern part of the investigated area, while light oil fractions were dominating in the central parts of the transshipment area.
On 14 May 2008, the TPHs bottom sediments concentration varied in the range of 568 fxg/g—1,188 |ig/g with the average of about 890 |ig/g. Their maximum was de¬tected at the place of the accident and much lower presence was recorded to the South from it.
In the beginning of autumn 2008 (on 23 September), the TPHs maximum was record¬ed nearly at the same level of about 900 (ig/g, nevertheless, the average was about 520 (ig/g to reflect a generally decreasing level of the bottom sediments petroleum pollu¬tion. Less than a month later the concentration of petroleum hydrocarbons was even lower, but in June 2009 it increased twice and reached 1,890 |ig/g. obviously unrelated to the Kerch accident.
6.2.3. UA: MHI. December 2007 and March 2008
The TPHs bottom sediments concentration was studied by MHI UNAS (Sevastopol) on 6-9 December 2007 and March 2008 (Fig. 6.1.7a). Total petroleum hydrocarbons presence varied in the range of 720 (ig/g-2,925 |ig/g of dry sediments. The high¬est reached level of concentration was 58.5 PC (Warmer H., van Dokkum, 2002). The maximum level of pollution was detected at the station located in the Kerch port vicinity and at two sites southwards from the Tuzla Island. The last two spots were very close to the transshipment places area and the Volgoneft-139 tanker catastrophe. Relatively high levels of TPHs presence were also recorded at the Azov Sea entrance to the Kerch Strait area by stations No 29 and No 37 (Fig. 6.1.6a). The results re¬ceived have clearly indicated a very high level of the bottom sediments petroleum hydrocarbons pollution over the entire Kerch Strait and in the adjacent areas. These data have confirmed the results of previous investigations (Petrenko O.A., 2008; Pet- renko O. A. et al., 2008). In some cases the Kerch Strait bottom sediments (fine-grain muddy soft bottom) were found more polluted than sandy bottom sediments located inside the Kerch harbor (Panov B.N., 2006) .
6.2.4. UA: IBSS. December 2007 and March 2008
In December 2007 and March 2008, IBSS investigated the Kerch Strait bottom sedi¬ments condition at 43 stations in total and at three coastal sites in addition. During the 12-18 December 2007 cruise onboard of thq Experiment RV, the Kerch Strait sediments samples were collected at 13 stations (Fig. 6.2.9a). Chemical composition of bottom sediments and level of their pollution by petroleum hydrocarbons were determined by applying the chloroform extracting substances (infra-red spectrometry). At some stations TPHs water presence was measured as well.
In the major part of the Kerch Strait the bottom sediments were visually muddy hav¬ing grey or deep-grey color with incorporation of large and small pieces of broken shells of bivalvians, fine and coarse sand. Rather often hydrogen sulphide smell from the samples was felt. At several stations the shells and coarse sand comprised the ma¬jor component of the sediments. The 3-5 mm surface layer of sediments was found oxidized and had a lighter color (Photo).

Fig. 6.2.4a. Sampling stations in the Kerch Strait on 12-18 December 2007, IBSS, the Experiment RV
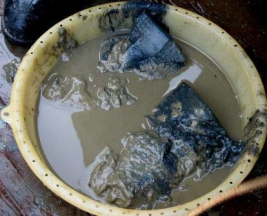
Photo. A typical sample of bottom sediments from the Kerch Strait, December 2007.
In December, TPHs concentration varied from 3 |ig/g to 168 |ig/g (3.4 PC) with recorded average of 66 (ig/g for 29 treated samples. In March 2008, the sediments contamination level remained the same. In 21 collected samples the TPHs average level was determined as 52 jxg/g (1 PC) and variations were less significant ranging between 17 jxg/g and 119 |ig/g. This level could be considered as a background one for the sediments of those polluted areas with intense shipping traffic. For compari¬son, the inner part of the Sevastopol Bight had the TPHs sediments presence as high as 6760 (ig/g, e. g., about two orders of magnitude higher (Mironov O.G., Kirukhi- na L.N., Alyomov S. V., 2003).
The IBSS investigation into the bottom sediments carried out soon after the Kerch catastrophe indicated absence of significant petroleum pollution resulting from the oil spill. In general, the recorded level was typical for those chronically polluted areas of the Azov and Black Seas. However, this investigation outcome contradicted the other institutions results indicating significant increase of bottom sediments pollution by TPHs after the oil spill accident in November 2007 (see Summary).
6.2.5. RU: The Shirshov 10 RAS. February-March, July 2008
On 28 February-9 March 2008, the Shirshov's Institute of Oceanology (SIO of the Russian Federation Academy of Sciences) and WWF undertook a joint field trip along the Taman coast (Spiridonov V. A. el ctl., 2008). The trip main tasks were as fol¬lows: to visually assess oil pollution of the coast; to determine contamination level of the coastal waters bottom sediments; to determine the biota oil contamination (of the bottom-dwelling organisms); to assess biological diversity of benthic communities present in the typical marine habitats for monitoring of potential changes and determin¬ing the benthic (bivalves) physiological state in order to assess the oil impact on them.
The exploration survey covered the Chushka and Tuzla Spits coasts and the shore line between the Ilyich and Cuchuguru villages, as well as the Dinsky and Taman Bays coasts. In the coastal zone, 39 divings and samplings were carried out (Fig. 6.2.5a). In total, 35 samples of bottom sediments, 66 samples of macrozoobenthos, 33 sam¬ples of visually contaminated aquatic organisms, to include 26 samples of animals and 7 samples of plants, and 8 samples of shellfish (for physiological state analysis) were collected. In addition, 15 descriptions of bottom vegetation were completed.
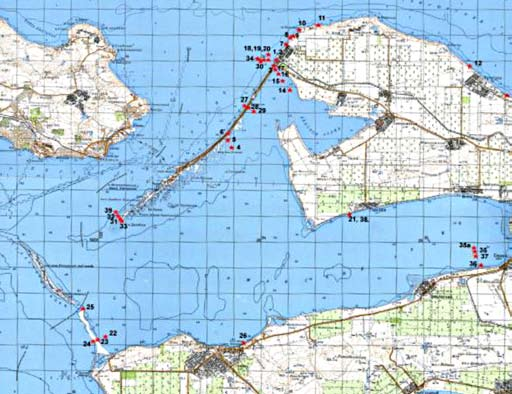
Fig. 6.2.5a. Scheme of the sea bottom visual diving survey and samples collection at the Kerch Strait Russian coast, 28 February-9 March 2008 (Spiridonov V.A. etcil., 2008; Koluchkina G.A., 2009).
Concentration of aliphatic hydrocarbons in the bottom sediments was measured (the Shimadzu GC-2010 high resolution gas chromatograph) at 35 stations within the Kerch Strait, Taman and Dinsky Bays coastal zones. The aliphatic hydrocarbons concentration varied spatially within the range of 0.01-1.77 (ig/g. All results of re¬search into aliphatic substances were recalculated into total petroleum hydrocarbons and presented in Figure 6.2.5b. Their maximum value of 1,106 (ig/g was registered at the Dinsky Bay station located 300 m offshore (to the South-West from the Chush- ka Spit at a distance of about 6 km from the Ilyich village). In those shallow wa¬ters (0.4 m deep) overgrown with reed, the sediments were either a slimy bottom or fine-grain pelitic sand with a high level of fine fractions (Fig.6.2.5c, St. 3,4,5a,5b in the Dinsky Bay). In addition to high percentage of 0.05 mm and less diameter fine fractions that varied from 9.15% to 14.77%, a rather high concentration of 3.28% of organic matter was recorded at the same spot as well. Similar slimy bottom areas were also found in the Dinsky Bay Northern part (St. 14,15,16), close to the Chushka Spit Southern end (from the Dinsky Bay side, St. 33, 0.4 m deep) and in the Taman Bay (few km away from the Sennoi village, St. 35a, 35b, 3.5-4.0 m deep). High concentration of hydrocarbons was recorded there reaching 113-250 |ig/g. 311 |ig/g and 729-888 (ig/g respectively, and it was associated with strong presence of organic matter and high percentage of fine fractions in the bottom sediments as well. At all the above mentioned sites, slimy sand consisted of pelitic particles.

Fig. 6.2.5b. Concentration of petroleum hydrocarbons at the stations located in the shallow waters in the Kerch Strait, Dinsky and Taman Bays during the period of 28 February — 9 March 2008 (Spiri- donovV.A., etal.,2008).
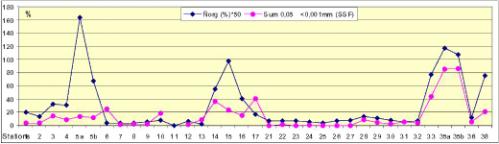
Fig. 6.2.5c. Percentage of organic matter (multiply 50) and small-size fractions (SSF) of 0.05 mm and less diameter in the bottom sediments of the Kerch Strait, Dinsky and Taman Bays during the period of 28 February-9 March 2008 (Spiridonov V. A. et al., 2008).
Concentration of petroleum hydrocarbons on the surface of small-size particles is largely associated with increase in their presence in the sediments with high share of organic matter and/or fine fractions of pelitic origin. To reduce it, normalization method is traditionally applied . After normalization, the hydrocarbons still rela¬tive abundance would point out to the places of abnormal pollution in comparison to the areas with background ratio of organic matter and hydrocarbons to potentially reflect the aftermath of the oil spill accident.
Few sites were determined at the Kerch Strait having the TPHs/Corg ratio higher than the background ratio of 294 (average calculated for this set of data, as his¬torical data are absent for the area), (Fig. 6.2.5d). The maximum was recorded in the Chushka Spit coastal area between the Ilyich village and the Ahilleon Cape that were heavily polluted during the oil spill accident in November 2007. That lo¬cation was not specified either in terms of high natural hydrocarbons concentra¬tion , or organic and small fractions presence in the sediments. Hence, an increased TPHs/Corg ratio revealed the presence of the spill residual effect. Other places with increased ratio were found close to the Taman city (St. 26) and at the Chushka Spit Southern end (from the Kerch Strait side). Also, both sites were affected during the Kerch accident.
The TPHs and smaller size fractions (SSF) ratio did not follow the TPHs/Corg one. It mainly had values close to zero. Only few stations reflected certain elevation of the parameter: In the coastal zone of central and Northern parts of the Tuzla Spit from the Taman Bay side (St. 23, 25); in the coastal waters nearby the Taman town (St. 26) and the highest ratio of 2,550 was detected at the Northern coast of the Chushka Spit from the Kerch Strait side (St. 27). The last area was one of the most polluted during the November 2007 oil spill accident.
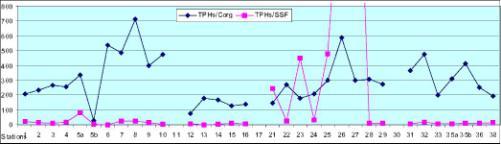
Fig. 6.2.5d. Concentration of total petroleum hydrocarbons normalized, in percentage to organic matter and fine fractions of 0.05 mm and less diameter, present in the bottom sediments in the Kerch Strait, the Dinsky and Taman Bays in the period of 28 February-9 March 2008 (Spiridonov V. A., et al., 2008).
The next expedition of SIO RAS was carried out on 16-31 July 2008. Sampling was organized along the coasts of the Chushka Spit and Tuzla Island, and in the Dinsky and Taman Bays (39 stations, Fig. 6.2.5e). Coastal visual surveys were conducted at 18 stations and the bottom of the Strait was surveyed at 21 stations to collect 36 bot¬tom sediments samples for further analysis for aliphatic hydrocarbons presence (Gas- Liquid chromatography — GC).
Practically no visual traces of heavy fuel oil presence in the water area were detected. The total organic carbon concentration in the bottom sediments varied from 0.02% to 5%, while the aliphatic hydrocarbons concentration fluctuated from 0.03 |ig/g at the Tuzla sand beach to 17.3 |ig/g in the inner part of the Dinsky Bay. The meanhydro- carbons concentration was considerably high reaching 2.45 |ig/g. However, the bottom sediments detailed analysis revealed at majority of examined sites the presence of pol¬lution that had undergone intensive processes of biodegradation and resedimentation. Hence, it could not be concluded that the Kerch Strait oil spill was the only source of pollution detected. The available data was insufficient for distinguishing the heavy oil spill hydrocarbons discharged during the Kerch accident from the region's chronic anthropogenic pollutants.
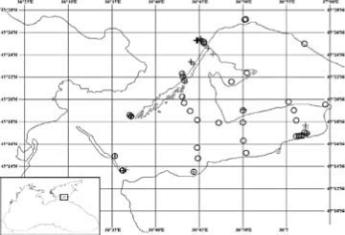
Fig. 6.2.5e. Scheme of observation stations operational during the SIO RAS expedition on 16-31 July 2008 (Koluchkina G.A., 2009). The stations operational during the first expedition on 28 February-9 March 2008 are marked with crosses.
6.2.6. UNEP Expedition: July 2008
UNEP carried out its expedition to the Kerch Strait in Ukraine’s littoral and costal zones during the period of 15–25 July, 2008 (Fig. 6.2.6a). Six bottom sediments samples were collected at the fairway of the Kerch-Enikale channel in the vicinity of the Tuzla Island at the depth of 2-8 m, while another 12 samples of sand with grass were collected at the beaches stretching from the Cazantip Cape to the Zavetnoe village in the Southern part of the Kerch Strait. Heavy fractions of petroleum hydrocarbons, i. e. naphthenes (cycloalkanes) and paraffins (alkane hydrocarbons), were determined as dominating and reaching the 80 %-90% levels in all samples (Fig. 6.2.6b). Concentration of those substances was 42 jxg/g — 110 |ig/g of dry soil in the samples collected in the littoral areas (Stations No 18-25). Their sediments presence was going up to 300 |ig/g — 600 |ig/g closer to the Volgoneft-139 tanker sunken bow part. No visual traces of heavy fuel oil were detected at the bottom of the area surveyed (UNEP, 2008).
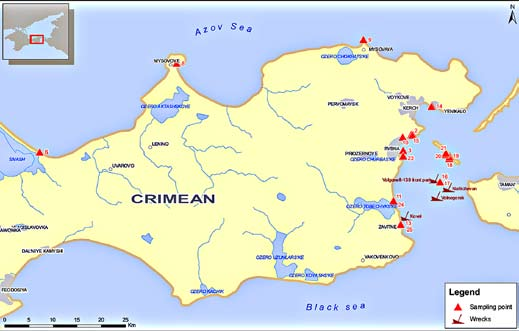
Fig. 6.2.6a. Stations location scheme. UNEP expedition to the Kerch Strait of 15–25 July, 2008 (UNEP, 2008, http://www.sea.gov.ua).
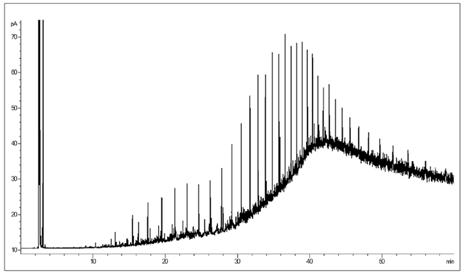
Fig. 6.2.6b. Chromatogram of M-100 oil transported by the Volgoneft-139 tanker. Domination of heavy oil fractions (C10-C35) is obvious. (UNEP, 2008, http://www.sea.gov.ua).
6.2.7. RU: ChAD. July, August, November and December 2008
At 154 stations, TPHs presence in the bottom sediments upper layer was studied dur¬ing three seasons of 2008 (Fig. 5.2.1a). In all collected samples the average concen¬tration was reaching 20.8±36.7 |ig/g. while several samples were discovered having TPHs concentration below the detection limit, e.g. analytical zero. The maximum concentration measured stood at 184.6 (ig/g that was equal to 3.7 permissible concen-trations (PC) for bottom sediments in accordance with the Netherlands Lists (Warmer H., van Dokkum, 2002). Well expressed patchiness of TPHs distribution in the bottom sediments was also recorded (Fig. 6.2.7a-c).
In summer 2008, three rather small areas with concentrations exceeding 1 PC were determined near the port of Caucasus at the Chushka Spit at the South-West from the Crimean coast and southward of the Tuzla Island. Slight increase in presence as compared with background concentrations was recorded in the area southward of the Enikale Cape. Patches of higher TPHs concentration detected could have orig¬inated from the Kerch Strait accident. The most polluted spots at the bottom were found by the Tuzla Island between the Chushka Spit and the Crimean Peninsula coast to the South from the Enikale Cape, and by the Western part of the Taman Peninsula between the Panagia Cape and Tuzla Cape also.

Fig. 6.2.7a. Petroleum hydrocarbons concentration (μg / g) in the Kerch Strait area bottom sediments averaged for July and August 2008.
In November 2008, only one patch with high concentration level (exceeding 50 (ig/g up to 139.2 |ig/g) was found. Its location was different from the sites inspected in sum¬mer being to the South from the Chushka Spit within the Taman Gulf (Fig. 6.2.7b). The second maximum observed in the Kerch Strait by the Chushka Spit was 30.8 |ig/g. The rest of investigated areas had a very low hydrocarbons concentration usually standing at below 5 |ig/g. The place where the Volgoneft-139 tanker bow part sank had the cleanest bottom sediments as compared to all the other areas investigated.
Fig. 6.2.7b. Petroleum hydrocarbons concentration (μg / g) in the Kerch Strait area bottom sediments in November 2008.
Strangely enough, a significant increase in TPHs concentration was observed in De-cember 2008 as compared with November (Fig. 6.2.7c). Large sections of the inves-tigated area (44 % of stations) appeared to contain the bottom sediments polluted by petroleum hydrocarbons above the norm of 50 |ig/g (Warmer H., van Dokkum R., 2002). Variation was high to range within 2.7(xg/g-184.6 and the recorded maximum was 3.7 PC. Several stations with maximal TPHs presence were located to the South of the Tuzla Island and close to the Volgoneft-139 place of accident. Meanwhile, almost all the sampled stations to the North of the Tuzla Island, including those in the Taman Bay, were also found to have a very high TPHs concentration level. Such a significant difference in petroleum hydrocarbons concentration data obtained in the result of two consecutive surveys (November, December) may imply that sources of pollution other than the oil spill accident of November 2007 were present, or that some kind of a serious analytical mistake was made in application of investigation methodology in November. Actually, the data collected in November evidenced an extremely low concentration that has made the results look quite doubtful.

Fig. 6.2.7c. Petroleum hydrocarbons concentration (μg / g) in the Kerch Strait area bottom sediments in December 2008.
6.2.8. UA: UkrSCES. July 2009 (30th cruise of the Vladymyr Parshin RV)
During the 30th cruise of the Vladymyr Parshin RV on 8 July 2009, samples of the Kerch Strait bottom sediments were collected at 12 stations (see Chapter 5, Fig. 5.2. la). Concentration of total petroleum hydrocarbons was investigated by means of an infra-red spectrophotometer with the Simard standard (Manual, 1996), while the level of total aromatic hydrocarbons (TAHs) was measured by means of spectrofluorometer with Ropme standard (Methods, 1992). Also, the same samples were studied for determining the concentration of or¬ganic carbon and phenols (Methods, 1995), (Tab. 6.2.8a).
Table 6.2.8a. Average concentration of total petroleum hydrocarbons, total aromatic hydrocarbons and phenols (|xg/g), and organic carbon (%) in the Kerch Strait bottom sediments on 8 July 2009.
| Parameters | Organic C,% | Phenols, |jg/g | TAHs, |jg/g | TPHs, |jg/g |
| Average | 0.900 | 0.78 | 15.8 | 149 |
| Minimum | 0.080 | 0.48 | 3.43 | 70 |
| Maximum | 2.076 | 1.35 | 23.3 | 265 |
TPHs and TAHs average concentration in the Kerch Strait waters exceeded the norm by about 3 times (Fig. 6.2.8a). Such a high level of TAHs could be attributed to the consequences of the Kerch Strait accident. Generally, aromatic hydrocarbons have a high molecular weight typical for heavy fuel and they may remain relatively resistant to chemical and microbial degradation for protracted periods of time.
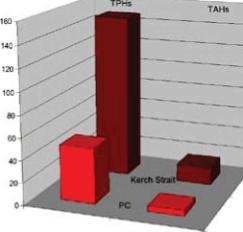
Fig. 6.2.8a. Average concentration of TPHs and TAHs (|xg/g) in the Kerch Strait bottom sediments on 8 July 2009
As for the TPHs spatial distribution a patch of high concentration was detected in the Crimean coastal zone westward from the Tuzla Island (Fig. 6.2.8b).
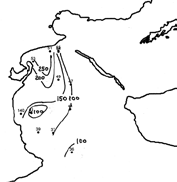
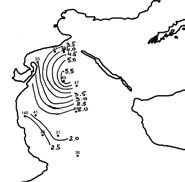
Fig. 6.2.8b. Real and aluminum normalized TPHs distribution in the Kerch Strait bottom sediments on 8 July 2009.
Strong interdependence existing between the bottom sediments granulometric struc¬ture and concentration of organic compounds including petroleum hydrocarbons is well known and it has been already mentioned above. Small clay and silt fractions have a strong capacity to keep pollutants attached to the surface of their particles (a good adsorbent of pollutants). Aluminum concentration is used for measuring the clay particles share of presence in the sediments and in the TPHs normalization process. The normalized distribution of petroleum hydrocarbons (TPHs/Al) has clearly shown that the bottom sediments maximum pollution occurred in the place of the Kerch Strait accident. However, one year and a half after the Kerch accident it is unlikely to still have the consequences of the Kerch oil spill itself only observed in the sediments. Most probably the elevated level of sediments pollution in this particular location is chronic and related to the nearness of the Kerch Strait transshipment area to the studied site.
Polycyclic Aromatic Hydrocarbons. The polycyclic aromatic hydrocarbons high¬est concentration in the bottom sediments was mainly detected by the Crimean cost slightly to the South from the Kerch Bight. PAHs average concentration exceeded PC by 3-5 times according Netherlands Lists (Warmer H., van Dokkum, 2002), (Tab. 6.2.8b and Fig. 6.2.8c).
Table 6.2.8b. Statistical characteristics of individual PAHs (ng/g) present in the Kerch Strait bottom sediments on 8 July 2009. Numbers above PC are given in bold.
| Parameters | Averaqe | Minimum | Maximum | PC |
| Naphtalene | 34.0 | 4.4 | 103 | 15 |
| Acenaphthvlene | 5.0 | 2.1 | 10.8 | |
| Acenaphthene | 4.8 | 1.1 | 7.0 | |
| Fluorene | 45.0 | 18.7 | 67.3 | |
| Phenanthrene | 229 | 149 | 330 | 45 |
| Anthracene | 7.3 | 1.9 | 15.5 | 50 |
| Fluoranthene | 122 | 23.8 | 302 | 15 |
| Pvrene | 75.0 | 9.6 | 182 | |
| Benzo (a) anthracene | 45.0 | 3.7 | 136 | 20 |
| Chrysene | 61.0 | 8.0 | 186 | 20 |
| Benzo (b) fluoranthene | 77.0 | 13.0 | 158 | |
| Benzo (k) fluoranthene | 84.0 | 16.0 | 218 | 25 |
| Benzo (a) pvrene | 46.0 | 3.7 | 115 | 25 |
| Indeno (1,2,3cd) pvrene | 49.0 | 12.5 | 95.6 | 25 |
| Dibenzo (a, h) anthracene | 10.0 | 1.1 | 25.0 | |
| Benzo (g, h, i) pervlene | 51.0 | 10.5 | 101 | 20 |

Fig. 6.2.8c. Average concentration of individual PAHs in the Kerch Strait bottom sediments on 8 July 2009
6.2.9. UA: UkrSCES. December 2009 (31st cruise of the Vladymyr Parshin RV)
On 4-15 December 2009, the Ukrainian Scientific Center of Ecology of the Sea (Odessa) carried out a second detailed research into the Kerch Strait bottom sediments petroleum hydrocarbons pollution onboard of the Vladymyr Parshin RV (31st cruise), (Fig. 5.2.5.2a, Fig. 5.2.5.2b). As a result, 32 samples were collected. In general, levels of petroleum pollution and phenols concentration were exceeding the norms almost in all the bottom sediments studied (Tab. 6.2.9a, Fig. 6.2.9a.).
Table 6.2.9a. Statistical characteristics of TPHs, TAHs, phenols and organic carbon present in the Kerch Strait bottom sediments in December 2009.
| Parameters | Averaqe | Median | Minimum | Maximum | Standard deviation |
| TPHs, uq/q | 102.6 | 100 | 60 | 140 | 23.1 |
| TAHs, |jq/q | 11.41 | 5.36 | 1.83 | 44.40 | 12.80 |
| phenols, |jq/q | 0.76 | 0.68 | 0.45 | 1.15 | 0.233 |
| orqanic C, % | 0.927 | 0.77 | 0.08 | 3.32 | 0.818 |
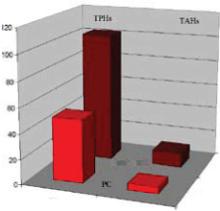
Fig. 6.2.9a. Average concentrations of TPHs and TAHs (|xg/g) present in the Kerch Strait bottom sedi¬ments in December 2009
The normalized distribution of petroleum hydrocarbons (TPHs/Al) has revealed the spots of petroleum hydrocarbons maximal concentration by the Volgone ft-139 tanker sinking place in November 2007 (and transshipment area at the same time) and slightly north¬ward from it in the proximity of the Tuzla Island Western end (Fig. 6.2.9b).
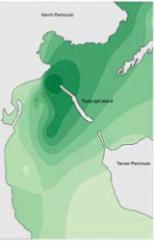
Fig. 6.2.9b. Spatial distribution of Aluminum normal¬ized petroleum hydrocarbons in the Kerch Strait bot¬tom sediments in December 2009.
The chronic character of the Kerch Strait sediments petroleum pollution was con¬firmed by a high concentration of poly cyclic aromatic hydrocarbons (Table 6.2.9b).
Table 6.2.9b. Statistical characteristics of individual PAHs (ng/g) present in the Kerch Strait bottom sediments in December 2009.
| Parameters | Average | Median | Minimum | Maximum | Standard deviation |
| Naphtalene | 39.10 | 39.8 | 10.9 | 70.3 | 14.98 |
| Acenaphthvlene | 2.913 | 2.63 | 1.23 | 5.74 | 1.320 |
| Acenaphthene | 7.265 | 6.85 | 2.0 | 13.10 | 2.572 |
| Fluorene | 27.34 | 23.8 | 13.1 | 60.3 | 12.93 |
| Phenanthrene | 84.62 | 83.4 | 40.4 | 142.0 | 23.82 |
| Anthracene | 26.85 | 26.1 | 10.7 | 52.6 | 11.51 |
| Fluoranthene | 51.80 | 43.2 | 20.1 | 109.0 | 27.77 |
| Pyrene | 44.0 | 40.2 | 15.9 | 90.8 | 21.99 |
| Benzo (a) anthracene | 56.93 | 53.1 | 8.4 | 106.0 | 29.37 |
| Chrvsene | 56.86 | 60.1 | 6.9 | 121.0 | 28.50 |
| Benzo (b) fluoranthene | 49.42 | 40.2 | 10.3 | 151.0 | 33.08 |
| Benzo (k) fluoranthene | 43.96 | 33.7 | 12.3 | 99.5 | 24.91 |
| Benzo (a) pvrene | 28.63 | 24.4 | 5.7 | 95.6 | 18.25 |
| Indeno (1,2,3cd) pvrene | 25.60 | 24.6 | 4.3 | 78.0 | 15.94 |
| Dibenzo (a, h) anthracene | 8.65 | 6.4 | 1.2 | 40.1 | 7.54 |
| Benzo (g, h, i) pervlene | 25.10 | 22.6 | 3.4 | 51.4 | 12.60 |
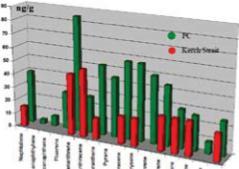
Fig. 6.2.9c. Average concentration of individual PAHs in the Kerch Strait bottom sediments in De¬cember 2009
Among the 16 studied individual PAHs, phenanthrene, fluoranthene, naphthalene, py- rene, benzoanthracene, benzofluoranthene and benzo (a) pyrene revealed the highest level of presence (Fig. 6.2.9c). All these chemical substances are highly toxic and may remain stable in marine environment without chemical or microbiological degrada¬tion for protracted period of time.
As compared with July, the TPHs and TAHs presence decreased in December by 1.4 times or 30% (Fig. 6.2.9d), however the TPHs and PAHs concentrations ratio re¬mained unchanged.
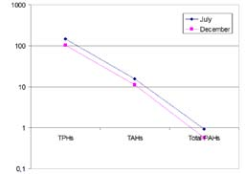
Fig. 6.2.9d. Concentration ofd petroleum hydrocarbons (µg/g) in the Kerch Strait bottom sediments in July and December 2009.
Quality control, concurrent measurements. Different laboratories in the Black Sea area measure the level of such priority pollutants as various forms of hydrocarbons, pesticides, PCBs and trace metals as shown in this book. To verify the comparability of those measurement results, an interesting inter-calibration exercise was undertaken during the December 2009 cruise of the Vlctdymyr Pctrshin RV. One and the same per¬son applying the same equipment was taking identical portions of sediments from one and the same grab at ten stations for their further parallel analysis to be carried out by analytical laboratories of UkrSCES (Odessa, Ukraine) and the Typhoon Chemical- Analytical Center (Obninsk, Russian Federation). Stations for shared bottom sediment analysis were mainly placed in the inner part of the Kerch Strait (marked in red in Fig. 6.2.9e).
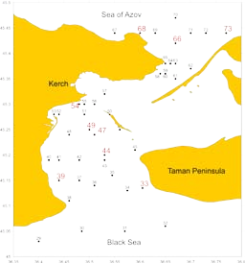
Fig. 6.2.9e. Stations for bottom sediments sam¬pling installed at the Kerch Strait during the 31st cruise of the Vladymyr Parshin RV for the period of 4-15 December 2009. The duplicated stations are marked in red
Sampling of the Kerch Strait bottom sediments during the 31st cruise of the Vlctdymyr Pctrshin RV was basically carried out in the rough weather conditions close to stormy. A Van-Veen grab with electric-powered winch was used for those samplings. After its uplifting, the grab was placed on the vessel deck. Subsampling was conducted by a chemist by means of a stainless steel scoop. With its help and by identical manipula¬tions four portions were taken from one and the same spot of the sediments surface in the grab. Two of them meant for the trace metals analysis were put into the plastic bags, while the second pair meant for organics analysis got covered by aluminum foil before being put into the plastic bags. All subsamples were collected from the upper layer of the bottom sediments. Immediately after that, the bags with subsamples were placed into a fridge with a temperature regime of minus 18"C. Half of those dupli¬cated subsamples were treated in Odessa, Ukraine (UkrSCES), while another half— in Obninsk, the Russian Federation (Typhoon) as mentioned above.
Based upon the results received, it became possible to identify a methodological error made during subsampling from the grab and to carry out a chemical analysis. A common suggestion would be that both chemical laboratories in Odessa and Obninsk were highly professional in carrying out the analysis of all chemical parameters under study. The state-ment is based not only on the fact of both laboratories having modern sophisticated equip-ment, trained personnel and well developed QA/QC procedures, but on the basis of their regular participation in different intercalibration exercises and excellent results achieved as well (like QUASIMEME, IAEA, etc.). For instance, the high level of professional¬ism possessed by both laboratories allowed to choose them as reference units for the bot¬tom sediments chemical analysis within the recent TACIS Caspian Sea Project entitled the «Caspian Water Quality Monitoring and Action Plan for Areas of Pollution Concern» (Voitsekhovitch O., 2009). However, the intercalibration exercise described here showed substantial differences in the results of the two laboratories for some parameters.
As the granulometry analyses done by both laboratories have shown, sediments in the Southern part of the Kerch Strait are rather rough and have a low presence of small fractions, while the sediments of the central and Northern parts of the Strait have an increased clay fraction presence (Fig.6.2.9f). In general, the difference in the two laboratories results varied within the range of 2.7-22.4% with the exception of Sta¬tion No47 revealing a 52.5 % difference. There were two options to explain such a big difference — either an analytical error was made or a non-equal subsampling from the grab was carried out. The latter option was found more probable, having in mind the professionalism of the laboratories involved.
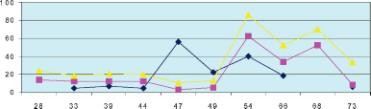
Fig. 6.2.9f. Percentage of small fractions present in the Kerch Strait bottom sediments as measured in parallel by UkrSCES (Odessa) and Typhoon (Obninsk) on 8-11 December 2009, 31st cruise of the Vladvmvr Parshin RV.
Both laboratories reported similar total organic carbon (TOC) concentration levels for the bottom sediments (Fig. 6.2.9g). Their recorded difference varied from a very low level of 0.26 mg/g to 111.84 mg/g, while no principle disagreement was observed. In this connection, it is recommendable to normalize the pollutants concentration on organic carbon content.
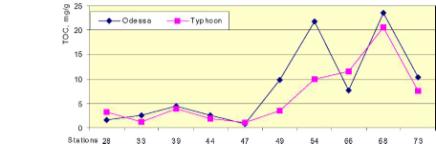
Fig. 6.2.9g. Concentrations of total organic carbon (TOC, mg/g) in the Kerch Strait bottom sediments simultaneously measured by LTkrSCES (Odessa) and Typhoon (Obninsk) on 8-11 December 2009, 31st cruise of the «Vladymyr Parshim) RV.
PAHs. The data provided by Odessa and Obninsk on the individual polycyclic aromatic hydrocarbons concentration subtotal significantly differed (Fig. 6.2.9h). Mean concen-tration of the whole first set of subsamples (Odessa) stood at 655 |ig/g. while the second set (Obninsk) averaged 4.3 times lower standing at 153 (ig/g. Approximately the same ratio was recorded for individual polyaromatic substances, for instance, the benzo (a) pyrene concentration in Odessa subsamples averaged 31.3 |ig/g and in the Obninsk set — 10.6 (ig/g.
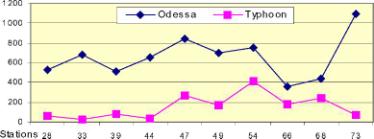
Fig. 6.2.9h. Concentration of total polycyclic aromatic hydrocarbons (PAHs, |xg/g) in the Kerch Strait bottom sediments on 8-11 December 2009, 31st cruise of the Vladymyr Parshin RV.
At the same time, the PAHs/TOC ratio obtained by both laboratories revealed a sim¬ilar spatial distribution with a visible maximum present in the place of the Volgone ft- 139 shipwreck (Fig. 6.2.9i).
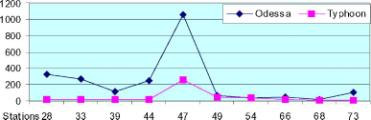
Fig. 6.2.9i. Normalized concentration of total polycyclic aromatic hydrocarbons (PAHs, |xg/g) on organic carbon content (Corg, mg/g) in the Kerch Strait bottom sediments on 8-11 December 2009, 31st cruise of the Vladymyr Parshin RV.
Similar exercises to normalize aromatic substances concentration in percentage to small fraction of the bottom sediments were performed by both laboratories (Fig. 6.2.9j). The data made available by the Typhoon subsamples have clearly indicated only one maximum detected close to the shipwreck. Results received from Odessa did not allow the same conclusion.

Fig. 6.2.9j. Normalized concentration of total polycyclic aromatic hydrocarbons (PAHs, µg/g) on concentration of small particles (%) in the Kerch Strait bottom sediments on 8 – 11 December 2009 during the 31st cruise of the Vladymyr Parshin RV.
The working hypothesis of an increased polycyclic aromatic hydrocarbons concentration in the Kerch accident place was tested additionally through applying the Aluminum nor-malization concentration (the fine clay fractions indicator in the soil). Both laboratories recorded a peak at Station No 47 and an additional one in each set of data (Fig. 6.2.9k).
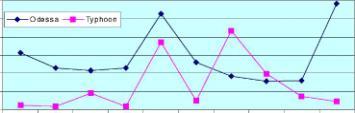
Fig. 6.2.9k. Normalized concentration of total polycyclic aromatic hydrocarbons (PAHs, |xg/g) on Alu¬minum concentration (mg/g) in the Kerch Strait bottom sediments on 8-11 December 2009, 31st cruise of the Vladymyr Parshin RV.
Evaluation of three different types of aromatic hydrocarbons normalization made it possible to conclude that a clear relation existed between the PAHs and total organic carbon concentrations. The PAHs/TOC ratio made it possible to determine the place of the Volgone ft-139 shipwreck though two years had already passed since the Kerch catastrophe. However, as mentioned above, the latter might be well related to chronic pollution and nearness of the transshipment area.
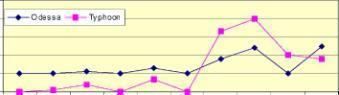
Fig. 6.2.91. Concentration of HCB (ng/g) in the the Kerch Strait bottom sediments on 8-11 December 2009, 31st cruise of the Vladymyr Parshin RV.
Pesticides. Analyses of chlorinated pesticides concentration in the Kerch Strait bottom sediments could be considered as non-satisfactory due to a revealed large difference in data sets provided by the two laboratories. The mean values received — 0.14 ng/g by Odessa and 0.12 ng/g by Obninsk— were very close (Fig. 6.2.91). However, the metabolites subtotal of HCHs (2.67 and 0.07 ng/g respectively) and DDTs (3.13 and 0.17 ng/g respectively) differed significantly by 1 or 2 orders of magnitude.
Metals. Among the tested metals of Al, Fe, As, Cd, Cr, Cu, Pb, Mn, Hg, Ni and Zn, some parallel sets like for chromium (means of Odessa versus Typhoon were 55.9 (ig/g/39.3 (ig/g), zinc (52.17 (ig/g/40.86 (ig/g) and cooper (13.1 (ig/g/11.7 (ig/g) had rather more similarity than difference, and the errors made by the laboratories could be considered as small (Fig. 6.2.9m, Fig. 6.2.9n).
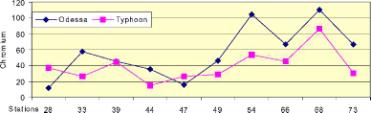
Fig. 6.2.9m. Concentration of chromium ((.ig/g) in the Kerch Strait bottom sediments on 8-11 December 2009, 31st cruise of the Madymyr Par shin RV
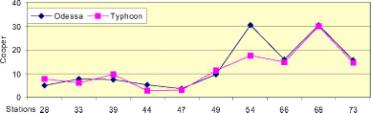
Fig. 6.2.9n. Concentration of cooper (|xg/g) in the Kerch Strait bottom sediments on 8-11 December 2009, 31st cruise of the Madymyr Par shin RV.
Quality results were obtained for aluminum (50240 (ig/g/53245 |ig/g). nickel (24.8 (ig/g/22.6 (ig/g) and mercury (0.030 (ig/g/0.022 (ig/g), (Fig. 6.2.9o).
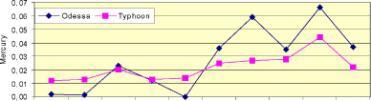
Fig. 6.2.9o. Concentration of mercury (|xg/g) in the Kerch Strait bottom sediments on 8-11 December 2009, 31st cruise of the Madymyr Par shin RV.
Worse results were obtained for lead, and every sample from Odessa had a significantly higher concentration than the one from Typhoon. As a result, the means differed substantially, i. e., 14.8 |ig/g and 5.04 |ig/g respectively (Fig. 6.2.9p).
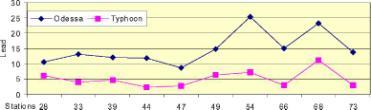
Fig. 6.2.9p. Concentration of lead (|xg/g) in the Kerch Strait bottom sediments on 8-11 December 2009, 31st cruise of the Vladymyr Parshin RV.
Conclusions. Concurrent measurement of important chemical parameters of similar sub- samples from one and the same grab, and their further treatment by highly experienced laboratories having sophisticated equipment and well-trained personnel have revealed a significant difference in the results obtained. The two participating laboratories reported similar data results of TOC and some metals. Few parameters like cooper have showed high data similarity. The organic pollutants data — PCBs and Pesticides — differed by 2-3 orders of magnitude. Disparity in results could be attributed to a methodological error made in the process of subsampling from the grab but, probably, also to the sampling preparation and analytical procedures further applied. Therefore, it is recommended to pay special attention to the quality control measures already at the sampling and sub- sampling stages. The extent of potential divergence of data obtained in different cruises and by different laboratories is easy to imagine, when such a huge difference is revealed in the result of a parallel subsamples analysis from one and the same grab.
6.2.10. Summary: Bottom Sediments Pollution by TPHs
The temporal dynamics of TPHs concentration in the Kerch Strait bottom sediments has clearly reflected the impact of the November 2007 oil spill accident. Rapid and significant increase of TPHs presence in the sediments was evidenced by various data received in different expeditions (Fig. 6.2.10a). Two institutions, YugNIRO and MHI registered high TPHs presence to exceed the norm by almost 60 times within a short period of two months after the accident. However, those concentrations could be well compared with the values registered at the highly polluted Kerch Bight where a six years average for the period of monitoring prior the oil spill showed the same pollution levels (Table 6.2.10a).
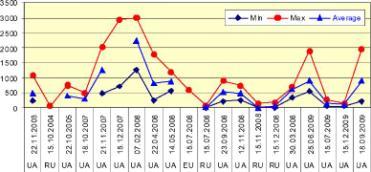
Fig. 6.2.10a. Temporal dynamics of total petroleum hydrocarbons concentration (|xg/g) in the Kerch Strait bottom sediments in 2003-2009. UA — expeditions completed by Ukrainian Institutions, RU — Russian, EU — UNEP Expeditions. The data of IBSS in December 2007 and March 2008 were excluded from the figure due to unclear methodology of investigation and major disparity in general results obtained.
Data of the seabed pollution prior to the Kerch catastrophe are scarce; still, they clearly reveal the relatively high TPHs concentration levels in the range of 1-20 PC. The recorded levels are even higher than those registered in the second half of 2008 and in 2009. During the last years (2008-2009) petroleum hydrocarbons concentration in the Kerch Strait bottom sediments has stabilized at the level of 10-20 PC. Some periodical fluctuation is recorded and probably it is not connected with the seasonal factor but rather with sources of pollution.
Patchiness of petroleum pollution distribution remains yet a major problem for data collection and proper calculation of average parameters. The maxima registered close to the place of pollution source (the Volgoneft-139 shipwreck) have revealed an increased level of TPHs presence after the accident which could be well expected. The accident was less reflected by averaged parameters and minimum concentrations to have shown their increase still after 11 November 2007. Importantly, the best evidence of the shipwreck place was given by a differently normalized data on polycy- clic aromatic hydrocarbons. It is possible that normalized PAHs continued reflecting the Kerch Strait accident traces for long time after it happened (e. g. end of 2009).
However, it seems that the oil spill accident of November 2007 had shorter in time and more local in space consequences, especially as compared to permanently present pollution resulting from illegal transshipment and intense maritime traffic in the Kerch Strait waters. The Kerch Strait environment remains chronically polluted by petroleum hydrocarbons and the Kerch Strait accident contribution to it has been negligible for the Kerch Strait waters and sediments, in general.
Table 6.2.10a. Total petroleum hydrocarbons concentration (|xg/g) in the Kerch Strait region bottom sediments.
| No | Period | Min | Max | Average | The maximum patch location | Expedition, organization |
| UA | Monitoring, 2000-2006 | - | - | 3,240 | the Kerch Bight | YugNIRO, Kerch |
| UA | 22 November 2003 | 230 | 1,090 (22 PC) | 490 | the Kerch Strait, central part | YugNIRO, Kerch |
| RU | 15 October 2004, Monitorinq | - | 59.5 (1.2 PC) | - | harbor of the port of Caucasus | SCHME BAS, Sochi |
| UA | 22 October 2005 | 750(15 PC) | 400 | the Kerch Strait | YugNIRO, Kerch | |
| UA | 18 October 2007 | 500(10 PC) | 300 | the Kerch Strait | YugNIRO, Kerch | |
| UA | November 2007 | 2790 | 6,990 (140 PC) | the Kerch Bight | YugNIRO, Kerch | |
| 11 November 2007 | ||||||
| UA | 21 November 2007 | 2,024 (40.5 PC) | 1250 | the Kerch Strait | YugNIRO, Kerch | |
| UA | December 2007 and March 2008 | 720 | 2,925 (58.5 PC) | the Kerch port, southward of the Tuzla Island | MHI, Sevastopol | |
| UA | December 2007 | 3 | 168(3.4 PC) | 66 | the Kerch Strait | IBSS, Sevastopol |
| UA | March 2008 | 17 | 119(2.4 PC) | 52 | the Kerch Strait | IBSS, Sevastopol |
| UA | 7 February 2008 | 2,988 (59.8 PC) | 2250 | the Kerch Strait | YugNIRO, Kerch | |
| UA | 22 April 2008 | 250 | 1,780 (36 PC) | 820 | the Kerch Strait | YugNIRO, Kerch |
| UA | 14 May 2008 | 568 | 1,188 (24 PC) | 890 | the Kerch Strait | YugNIRO, Kerch |
| EU | July 2008, UNEP | 600(12 PC) | South of the Tuzla Island, the tanker crush place | UNEP Expedition | ||
| RU | 24 July 2008 | 2.1 | 80.7 (1.6 PC) | 18.08 | westward of the Chushka Spit end | RosPrirodNadzor |
| UA | 23 September 2008 | 220 | 900(18 PC) | 520 | the Kerch Strait | YugNIRO, Kerch |
| RU | 6-15 November 2008 | 0.0 | 139.2 (2.8 PC) | 5.1 | southward of the end of Chushka Spit | RosPrirodNadzor |
| UA | 12 November 2008 | 250 | 740(15 PC) | 490 | the Kerch Strait, central part | YugNIRO, Kerch |
| RU | December 2008 | 2.7 | 184.6 (3.1 PC) | 54.3 | South of the Tuzla Island | RosPrirodNadzor |
| UA | 25 June 2009 | 540 | 1890 (38 PC) | 900 | the Kerch Strait, central part | YugNIRO, Kerch |
| UA | July 2009 | 70 | 275(5.5 PC) | 149 | westward of the Tuzla Island | UkrSCES, Odessa |
| UA | December 2009 | 60 | 140(2.8 PC) | 102.6 | westward of the Tuzla Island | UkrSCES, Odessa |
Subchapter 6.3. Pollution of the coast caused by the Kerch accident and actions taken
Fashchuk D., Lavrova O., Strochkov A., Mironov O., Alyomov S., Spiridonov V, Ma- karov A., Kolyuchkina G., Simakova U., KhlebopashevP.
Sandy beaches, sandstone rocks and rocky shores enclose the Kerch Strait and they are typical for the region morphological coastal structures (Chapter 1). The Chushka Spit with the Caucasus harbor is part of the Tamano-Zaporozhskiy ornithological protected area. No marine natural reserves are located on the Ukrainian side of the Strait with the exception of two small protected areas on the coast facing the Azov Sea. However, there are many popular beaches and aquaculture farms. As of January 2010, a natural park was planned to be set on the island of Tuzla covering the territory of 27,865 hectares of public land, while a monastery located on the island was designated as a «site of cultural heritage».
A spill over 700 tones is considered large. Besides, the polluted area was at the heart of migration route of the red-throated and black-throated Siberian diver birds while on the way from Central Siberia to the Black Sea. Coastal wetlands there, are the migratory breeding grounds for numerous seabirds and waders. As such, most birds suffered from the oil pollution of the Kerch Strait coastal area after the accident in November 2007.
The spill possible effect on the coast was not immediately clear and the mass media (Ukrainian and Russian Newspapers, Reuters, CNN, BBC News, and others) were carrying contradictory information during the first days after the Kerch accident.
On 12 November, the coasts of the Tuzla and Chushka Spits and of the nearby coastal villages of Ilyich and Priazovskiy were reported hit by the oil spill. The actual extent of contamination varied significantly along the shorelines of the Kerch Strait. The Tuzla Island in particular suffered severe levels of contamination in comparison to connecting shorelines along the Kerch Strait. Selected areas to the North of the Kerch Strait along the coast facing the Azov Sea up to the Cape Kamenny were also polluted by small quantities of heavy fuel oil.
Oil products with high content of such light fractions as gasoline, acetone and kerosene pose the main threat to the aquatic environment. Fortunately, heavy fuel oil is almost free from such fractions being the next-to-last stage of oil distillation. The oil film was torn to tatters by the 11 November 2007 storm and hardly posed a serious threat to the underwater inhabitants after that. Cormorants, gulls, pochards and other water birds inhabiting the coast were affected the most. In the zone of contamination fuel oil stuck to the bird feathers depriving them from ability to move. As a result, a large number of seabirds perished during the acute phase of the oil spill. Early reports on the Ukrainian side situation mentioned 150 birds killed, while other estimations reported up to 30,000 seabirds killed by the oil spill in November-December 2007.
Individual bodies of dead dolphins were discovered at the shore line. However, their death could have resulted from collision with vessels or the storm waves. A large number of shellfish was found on the coastal strip, though their death cause was not defined. Those dead creatures, like birds, started creating a significant problem while decaying: They became heavily consumed by the necrophagouses and that threatened to spread contamination and possible diseases deep into the areas adjacent to the Kerch Strait.
Human resources (manpower) exceeding 2.5 thousand persons and more than 300 units of technical equipment were involved in the coastline clean-up operation. Specialized sub-divisions and rescue teams, military formations, fire-fighting brigades, the Maritime Academy cadets and governmental workers from Novorossiysk and other towns, and villages were engaged with eliminating the oil spill aftereffects.
Local and international organization like WWF, Greenpeace, Birds International (Russian Federation), International Fund for Animal Welfare (IFAW) and Sea Alarm jointly with volunteers and governmental officials from different cities worked to clean the coast and save the wildlife. The Wildlife Rescue Operations in the Black and Azov Seas Oil Spill Area project enjoyed support of the WWF, the Netherlands and Norway as well as of the numerous Russian WWF supporters mainly representing the Russian Caucasus regional branch. More than 1,000 volunteers from the Krasnodar Region (students and teachers from five universities) contributed to the effort. Hundreds of volunteers from Russia and other CIS countries provided assistance to the animals affected by the oil spill.
An interesting document entitled the «Diary of the Center of Accident Diminishing)) has been published at: http://www.wwf.ru/about/what_we_do/oil/kerch07/diary. The following sequence of coastal activities was reconstructed based on the mentioned diary, publications in the newspapers (citing statements of the Russian and Ukrainian officials) and scientific papers:
13.11.2007. As soon as the weather conditions allowed, the port services started the clean-up operations. They raked fuel oil together with contaminated soil into piles to be further on loaded onto trucks and taken away for dumping. During 12 and 13 November, more than 900 tons of contaminated soils were collected at the shore of the Kerch Strait and the Temruk district of the Krasnodar Region to be sent for disposal to a special site in the Sennoy village of the Temruk district. The water surface contamination was eliminated through topping oil film with special sorbent powder (crushed sawdust and peat) to bind the oil particles and make them easy to collect from the surface. Oil film was collected from the sea surface by specialized vessels to be further discharged into reception facilities at the port. As a whole, about 2.5 tons of the oil-in-water emulsion was collected.
WWF was assigned to coordinate efforts to rescue birds at Taman. At the initiative of the Russian Caucasus (the WWF regional branch), a public focal point for salvation of the waterfowl affected by the fuel oil spill in the Kerch Strait was established.
16.11,2007. Operations to clean up the birds and coast line continued: Army men worked at the Chushka Spit jointly with some 100-120 people from the Novorossiysk administration and municipal enterprises, as well as with 60 persons, the gamekeepers from the Temruk District Society of Hunters and Fishermen. Fuel oil mixed with seaweed was found on the shore in the form of large heaps stretching for about 10 km in length and 3-5 m in width. As well, dead birds, mostly coots, were found lying in those fuel-oil heaps. Rangers collected the dead birds into the bags and left them by the road to be later collected and loaded onto the truck. Several birds alive were found. The problem was that polluted birds kept coming to the shore to fall into the oil. Thus, it was difficult to catch them. Further on, they went back to the sea to unattainable distance. Also, bodies of two dead dolphins were reported found.
The Novorossiysk Administration personnel and army men were cleaning the coast from oil with shovels and pitchforks, and the collected materials were picked up by trucks. Daily, about 400 m were cleaned up. It is possible that the shore near the port of Caucasus was cleaned up with technique. At the first glance, the beach looked as almost turned over and multiple inclusions of fuel oil were left on the sand. It could be assumed that manual labor for cleaning fuel oil was more effective, although much more labor intensive. Contaminated soil was transported to the landfill owned by a private company. The company management noted that polluted soil was brought for temporary storage only. How and where the soil was supposed to be cleaned up, at that time remained undecided. At least one truck of polluted soil, most probably by mistake, was unloaded at a waste landfill.
In the immediate proximity to the spill at sea three trawlers were engaged with fishing during the clean-up operations. Accessory of the vessels could not be identified. As far as we know, the Ukrainian authorities did not allow selling fish caught in the shipwreck vicinity.
17.11.2007. Help was coming by sea, land and air to the Taman Peninsula. More than two thousand people and 200 pieces of equipment were involved in the rescue operations. By that time, 26 km had been cleaned up already. As such, 2,270 tons of polluted materials mostly impregnated with fuel oil algae, soil and debris were collected the day before, while 7,019 tons in total were collected since the operations start. More than a thousand dead birds were taken to the designated burial area. The volunteers arrived were trying to save the birds.
21.11.2007, According to the scientists, the estimated damage was 20 billion rubles. According to the Rosprirodnadzor, it was 6.5 billion rubles. 26.11.2007, Still, no reason for optimism had arrived, since a new portion of fuel oil appeared on the Chushka Spit.
30.11.2007. By that day, 30 km of the shore line had been cleaned up, 5,000 birds were buried, the damage was estimated as 30 billion rubles and five criminal cases had been initiated.
11.12.2007, The Krasnodar Region covered the cost of the shipwreck consequences elimination.
In total, 180 km of the coast line were damaged by the oil spill, and 53 km out of them had been cleaned up. About 40,000 tons of oily garbage was collected at the shore, while two storage places for oily garbage were arranged. The clean-up operations at the Tuzla Spit were completed, while similar operations at the Chushka Spit continued going on. Ecologists came to the opinion that the clean-up operations negative aftermath was possible and that the main lesson to learn was the necessity to work out the rules for handling the environmentally hazard cargo in the Russian Seas water area. Sorbents were applied for utilization of oil from the collected wastes.
During the emergency and recovery activities, the sea and shore birds perished, being contaminated by oil, were collected, counted and utilized. The total amount of perished birds was 5,487, while 244 birds were collected alive. In the process of rehabilitation 91 birds died, 111 birds got completely rehabilitated to be released back to the wild, and 42 specimens were transferred to the World Wildlife Fund regional branch. The practical treatments of damaged birds were in line with recommendations of Handbook on Oil Impact Assessment (Camphuysen C. J., etal, 2007).
Still, some parts of the Chushka Spit remained covered with heavy oil.
5.02.2008, The clean-up activities went on, the birds still continued dying.
16-17.02.2008, An information was spread around that fuel oil traces had arrived on the Ukrainian part of the Kerch Strait coast, however no such traces on the Russian part of the coast were found.
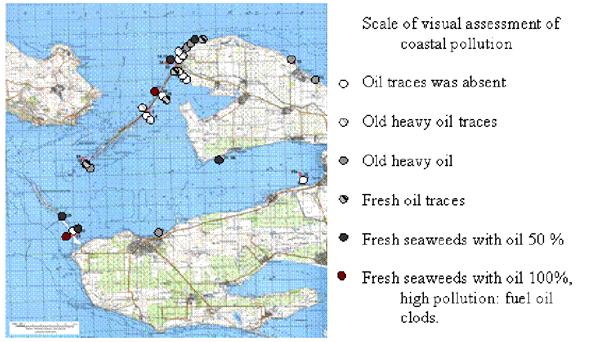
Fig. 6.3.1a. Scheme of coastal pollution visual assessment as observed during the SIO RAS-WWF expedition of 26 February-15 March 2008.
Finally, the total area of the sea surface pollution in the Black and Azov Sea basin was estimated to be 664 km2, and the total length of the coastline contaminated with oil products was assumed to be about 183 km (Booklet, 2009).
In the period of 26 February-15 March 2008, the P. P. Shirshov Institute of Ocea- nology and WWF-Russia studied the consequences of the Kerch Strait oil spill. According to the visual observations over pollutants at the shores, the most contaminated were found the sea side areas near the Ilyich village, Chushka Spit, Taman Bay, and the Tuzla Spit (Fig. 6.3.1a).
In September 2008, certain experts participated in a visual inspection conducted at the Tuzla Island, the port of Caucasus and the Taman coastal village area. Together with IKI RAS (Institute of Space Research) specialists, the third-year ecology and Earth-sciences students from the Dubna International Nature, Society and Humanity University took part in the carried outworks (Photo: a). In the Taman village area, neither the coast, nor the seabed with seaweed communities bore the heavy fuel oil marks. Local residents witnessed no significant quantities of heavy fuel oil washed ashore after the Kerch catastrophe.
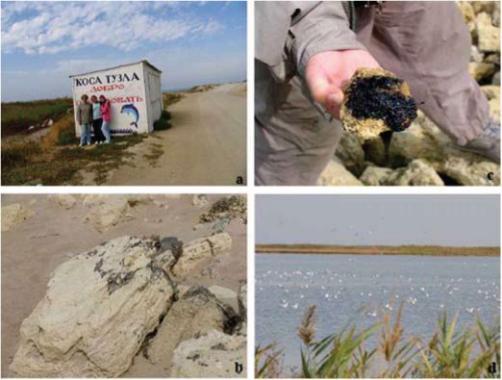
Photo: Photographs taken in September 2008 on the Tuzla Island during the expedition:
a) Anya Gusarova and Irina Rybakova, the third-year ecology and Earth-sciences students of the Dubna International Nature, Society and Human University with their supervisor O.Yu. Lavrova (IKI RAS); b) polymerized films of heavy fuel oil brought ashore in November 2007; c) «new» smearing heavy fuel oil washed ashore in summer 2008; d) seabirds at the Northern coast of the Tuzla Island.
At the same time, heavy fuel oil pollution was detected along the Southern coastline of the Tuzla Island: Under the stones and in patches on the shore, while covered with sand mixed with piles of dead seaweed. Together with the «old» heavy fuel oil in the form of polymerized films and brought at the time of the 2007 catastrophe (Photo: b), the «new» heavy fuel oil was discovered washed ashore, obviously, during the 2008 summer (Photo: c). That was pollution caused by the oil left from the Kerch accident and rising from the shallow seabed to the surface due to the water temperatures increase. On the contrary, no pollution was observed at the tip of the Tuzla Island where to considerable amounts of heavy fuel oil were most probably brought at the time of the catastrophe. It is quite possible that the fuel oil was washed away shortly after the accident, as the average current velocity stands at 2-3 m/s in that narrow passage between the Tuzla Island and the Tuzla Spit. No heavy fuel oil pollution was found on the Northern coastline of the Tuzla Island either. Numerous seabird populations were found in a satisfactory state and the numbers of birds did not seem to have diminished in comparison to those observed during the previous years (Photo: d). Seabirds were seen actively diving for food proving that the seabed at the Tuzla Island Northern coastline was safe from oil pollution.
The air survey conducted on 14 November 2007 found no visual evidence of significant oil pollution of the Ukrainian Kerch Strait coast during the first days after the disaster.
Starting from 15 November, Environment Committee of the Autonomous Republic of Crimea (ARC) carried out regular monitoring of soils in the coastal zones of the Kerch Strait, Leninsky district, and the Tuzla Island. Eighty-two test points were arranged to measure contamination with oil and nine test points — with sulphates. As of 9 July 2008, 1,856 samples had been collected and examined for concentration of oil and 112 samples — for sulphates. The repetition factor of the background concentration excess sustained some 1,500 times in the first days after the oil spill. In the result of the clean-up operations, after 9 July 2008 the maximum excess was registered as nine times on the Tuzla Island only.
The Tuzla Island, as the most polluted part of the Kerch Strait in the result of the accident, was regularly monitored in the period of 11 November-3 December 2007 by the IBSS scientists. The first observations showed a high degree of patchiness in the distribution of oil pollution in the coastal zones. Some places were completely clean from oil while in the others coverage was complete at the shore line and at the 5-10 m wide stripe of water.
13 November. Fuel oil mixed with algae was detected in the surf zone of the Tuzla Island coast line from its South-Eastern to the North-Western part. The width of the impacted territory ranged from 1 to 10 m and the thickness — from 1 to 10 cm.
15 November. The area polluted by the fuel oil covered about 2,000 square meters.
17 November. It was discovered a strip of oily dead algae stretching for 2,500 m in length and 1-3 m in width along the Tuzla Island Northern coast line. No new polluted areas were detected on 18-27 November.
28 November. A strip of oily dead algae stretching from the Tuzla Island North-Western part towards its South-Eastern tip was observed. The strip was about 2,000 m long reaching from 0.5m to 10 m in the width. Also, tatters of fuel oil were found.
1 December. In the Tuzla Island North-Western part, a strip of oil spots was discovered reaching the length of 500 m and width from 0.5 to 25 m. After that, another narrow strip of fuel oil being about 500 m long and 5 m wide was detected at the Southern coast of the island. 14 dead bodies of birds (coot, pochard, cormorant) were detected. Level of the coast line pollution by oily algae remained unchanged. The polluted area stretched for approximately 2 km being from 1 to 5 m wide.
December. Characteristics of the Tuzla Island North-Western end remained unchanged. Along the coast line, the oil spots continuous band being 5 km long and 5 m wide stretched from the island North-Western tip to its South-Western part.
December. The last visual observation was carried out in December. No emergence of new oil pollutions was observed at the Tuzla Island. However, strips of oily algae at the North-Western edge of the island were detected as 3,500 m long and 5 m wide. Dozens of dead bird bodies, mostly coots, cormorants and dives were discovered during the observations.
In November 2007, 8.5 km of shoreline were reported cleaned. Since the clean-up operations start, 3,248 tons of wastes were collected. On the Ukrainian coast, volunteers, employees of the Ministry of Emergency Situations (MES) and servicemen of the Armed Forces of Ukraine took part in the clean-up operations. Collection and disposal of oil was successfully completed on the beaches of the Tuzla Island (Photo below). However, remnants of oil materials left in the open bags at the sensitive sites close to recreational areas were found abandoned a few months later. That has revealed information shortage about the storage facilities location jointly with an absence of a timely organized waste management.
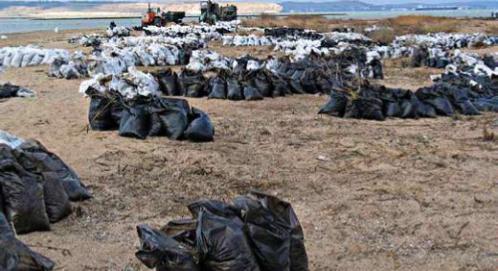
Photo: Oil-polluted sand was collected, packed and transported to Kerch for utilization by the Ukrainian volunteers (I. Kudrik picture).
In December 2007, the Kerch Strait got frozen and all clean-up activities were suspended. Up until that point, 5,440 tones of oil sand mixture had been collected from the contaminated coastal areas. Following the ice melt, additional 1,700 tones of waste were collected. Wastes were initially put into bags and then transported and stored at the Kerch Port bonded area to ensure that no further leakage occurred. Ukrainian Ministry of Environment Protection (MEP) was designated responsible for waste management. As such, it requested the oil sand mixture treatment and processing to be carried out in the Kerch port instead of burring it in the clay mines. A special governmental commission, established by decision of the Ukrainian Cabinet of Ministers of 19 March 2008, by its decision No 496 approved application of technology proposed by Ecocenter Ltd. from Kirovograd (http://www.ecocenter.com.ua/index_e. htm). The waste was stabilized and transformed into inert substance through mixing with other materials, and the newly-produced mixture was reused in road construction after that. At the time of the Kerch port inspection by UNEP on 14 July 2008, approximately 1,500 tones of waste still remained to be processed. In total, the oily wastes collected along the Ukrainian coast were estimated to be 7,140 tones. Meanwhile, oil content of the sampled oil-contaminated sand collected ranged from 4% to 30%. However, these numbers could be well over-estimated, as they imply that 285-2,000 tons of oil arrived at the Ukrainian coast. In practice, most of the spilled oil arrived at the Chushka and Tuzla Spits and contaminated the Russian coast mostly.
Many surveys were conducted by the local residents, fishermen, employees of the MEP and MES of Ukraine, and authorities of the Kerch commercial port, since all of them were participants in and witnesses of the November 2007 event. According to the local residents, in the Kerch Bay and the Kerch Strait Northern part (tiny villages of Capkanu, Sipyagino, Opasnoe, the Crimea port, Zhukovka) no mass arrivals of heavy fuel oil to the coast were observed, except for a small portion of up to three barrels of oil to create patches in the area of the Turkish Eni-Kale fortress that were promptly collected by the MES staff. The coast to the North from the Crimea port till the Hrony Cape in the Azov Sea was not affected by oil pollution either. Moreover, a flock of swans would occasionally dove along those coasts (near the Crimea port) searching for food, which indicated that no oil was on the bottom. However, according to the information provided by the fishermen, their bottom fishing gear got often stained in black oil in the vicinity of the Zhukovka coastal village (to the North from the Crimea port). It was possible that at the Northern entrance of the Kerch Strait a seabed oil pollution of mosaic nature had occurred.
In March 2008, significant coastal waters contamination with oil film was observed in the course of survey conducted at the Ukrainian coast of the Kerch Strait in the areas to the South from the Crimea port (the Opasnoe village, beam anchorage No 454). A strong smell of oil present in the air was indicating a «freshness» of spillages. That pollution of the Kerch Strait waters with volatile fractions of petroleum products was obviously not related to the Volgoneft-139 tanker accident. Probably, the reason was an oil release to occur during petroleum products pumping from a small boat to a larger one (transshipment) for further transportation by sea. For those — officially not allowed — operations an anchor place to the South from the Tuzla Island was often used.[11]
According to the officers of the post-disaster service of the MES of Ukraine, the Ukrainian coast strongest pollution occurred in the area of the Ak-Burun Cape and Arshintsevskaya Spit not during the storm and right after the Volgoneft-139 tanker accident, but a week later on 17-19 November. In order to eliminate contamination of the bays at the Ak-Burun Cape, up to 500 bags of contaminated sand were removed from the area daily. Beaches of the Arshintsevskaya Spit and bays of the Ak-Burun (White) Cape are the territory presently belonging to the Kerch historical and archaeological museum. By March 2008, those beaches had been cleaned. Visual inspections later resulted in discovery of just a few spots of oil preserved under the stones and on the rocks in the Ak-Burun Bay. The head of the State Ecological Expertise and Environmental Control in the city of Kerch reported about a diving survey carried out in the vicinity of the Arshintsevskaya Spit by the MES of Ukraine in March 2008. In its result no oil was found on the bottom of the Kerch Strait.
Subchapter 6.4. Satellite monitoring of the oil spill in the Kerch Strait
Lavrova O., Bocharova T., Mityagina M.
6.4.1. Satellite monitoring of the oil spill in November 2007
6.4.2. Satellite monitoring of the Kerch Strait in summer 2008
6.4.3. Satellite monitoring of oil pollution in the Kerch Strait region in 2009
6.4.4. Summary: Satellite monitoring on the Kerch Strait
6.4.1. Satellite monitoring of the oil spill in November 2007
Due to a complicated meteorological situation, helicopter survey of oil pollution and heavy fuel oil patch mapping became possible on November 14 only, i. e., three days after the catastrophe (Fashchuk D. Yu., 2009, Ivanov A. et al., 2008a). As well, satel¬lite visual imaging was not informative enough due to heavy cloudiness.
Since the synthetic aperture radar (SAR) on board of the Almaz-1 satellite completed its work in 1992, no Russian radars have been in operation on board of the earth-orbit¬ing satellites. At present, the most accessible and purposeful data are provided by the Envisat and ERS-2 European satellites. These data have spatial resolution most ad¬equate for the purposes of environmental monitoring of the sea surface, i. e., 25x25m for the scene size of 100x100 km, and 150x150 m for the scene size of 400x400 km. SAR is able to work at two polarizations and their combinations, i. e., VV, HH, VH, HV. The sea surface oil pollution is best detected through using the VV polarization data (Brekke C., Solberg A. H. S., 2005). SAR data from the Canadian Radarsat-1/2 satellites are commercial and nearly inaccessible because of the high cost.
For technical reasons, the SAR ad-hoc emergency imaging of the Kerch catastrophe site was not conducted. The earliest SAR images publicly available were the Radar- sat-1 data dated November 15 (15:34 UTC) and 16 (03:45 UTC) obtained and processed by the Scanex R&D Center (Ivanov A. and Zatyagalova V., 2008 a, b, c). A few minutes after the second image taking (Nov.16, 03:52 UTC), data from the frontline SAR on board of the TerraSAR-X satellite belonging to the German Space Agency (DLR) were received at vertical and horizontal polarizations with 3m resolution. The TerraSAR-X images were obtained in the framework of the MOPED international project (Bocharova T. et ctl., 2008). The data were of great importance due to their higher resolution in comparison to the Radarsat data posted on internet, thus enabling an accurate geo-referencing. Another SAR image of the catastrophe site was obtained from Envisat on November 16 at 19:39 UTC at vertical polarization of 12,5m pixel. Analysis of the above mentioned data combined with a helicopter survey data enabled assessment of pollution and its development. Fig. 4 presents the Radasat-1 fragments (Fig. 6.4.1a), and the TerraSAR-X (Fig. 6.4.1b) and Envisat ASAR (Fig. 6.4.1c) images. In all the images, a nearly single-point pollution source was clearly detected: It was the Volgoneft-139 tanker bow part. No traces of pollution propagating from the tanker stern aground were seen anymore. Oil pollution stemming from the location of the tanker's stern part was observed during the November 14 helicopter survey. On November 15, the tanker stern was tugged to the port of Caucasus and it stopped being a source of pollution, being well surrounded by booms.
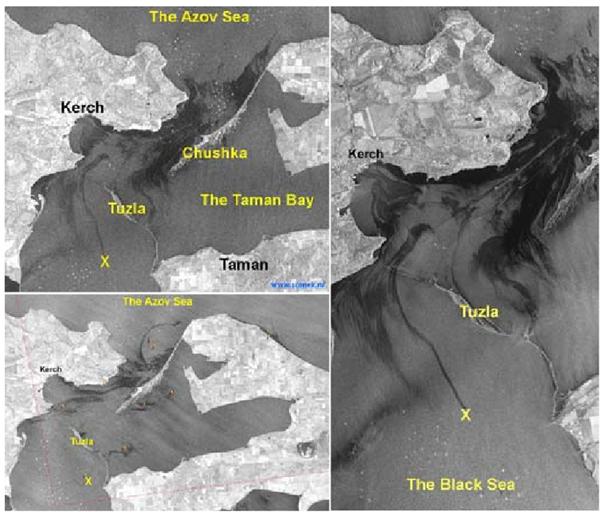
Fig. 6.4.1. Satellite SAR imaging of the Kerch Strait on 16.11.2007, i. e., five days after the catastrophe. Location of the Volgoneft-139 tanker bow part is marked with a cross.
a) Fragment of the Radarsat-1 image acquired at 03:45 UTC (© CSA, R&DC «ScanEx», 2007); (top)
b) Fragment of the TerraSAR-X image acquired at 03:52 UTC, resolution 3 m (© Info Terra 2007); (right) Kerch
c) Fragment of the Envisat ASAR image acquired at 19:39 UTC, resolution 12,5 m (© ESA 2007) (bottom)
Also, all the three SAR images showed the second nearly single-point pollution source being the Western tip of the Tuzla dam. Evidently, during the previous days storm a large amount of heavy fuel oil got washed ashore by a strong northward current from the Black Sea. After that, heavy fuel oil kept being washed further away to the North in the direction of the Chushka Spit and into the Taman Bay (Lavrova O. el al., 2008 a, b).
Particularly interesting were the low SAR signal dark regions occupying almost the whole Northern part of the Kerch Strait. They looked most impressive in the morn¬ing images (Fig. 6.4. la, b). Although modeling performed by the experts of the State Oceanographic Institute (Ovsienko S. el al., 2008) evidenced that pollution was ex¬pected to propagate all along the Chushka Spit, it did not seem probable that the whole low SAR signal dark region was an exclusive result of the oil spill accident of the Volgoneft-139 tanker. A more reasonable assumption was that the huge slick area had been formed by a light oil film pollution emerging from other boats caught by the storm at the Azov side of the Kerch Strait. A large number of boats were easily visible at all three SAR images (bright specks).
In evidence of the fact that along with the heavy fuel oil from the Volgoneft-139 tanker, a large amount of oil was spilled into the Northern part of the Kerch Strait by other ves¬sels, a document entitled a «Note-Report Of the Situation at 18:00 in the Kerch Strait, Near the Port of Caucasus And the Novorossiysk Port In the Result Of a Strong Wind Under Unfavorable Weather Conditions Prevailing Over the Krasnodar Region Terri- tory» was forwarded to the regional division of the Russian EMERCOM on November 11, 2007, i. e., 12 hours after the tanker catastrophe. In particular, the document said: «In the vicinity of the Ilyich settlement, a heavy fuel oil patch of 800 m long and 10 m wide was detected at the shore». Meanwhile, modeled estimations were predicting the tanker's heavy fuel oil propagation to the area not earlier than in 48 hours the earliest.
Estimations of the sea surface pollution area obtained during the aerial and satellite visual observations mentioned above did not confirm the assumption that oil was spilled as a result of the Volgoneft-139 tanker accident only. According to the aerial data, the heavy fuel oil patches size was reaching 200-400 m2 and the light oil films occupied a somewhat larger area. On the contrary, pollution area detected by the SAR data analyses later was much larger and was covering tens of square kilometers. Pres¬ence of such a huge difference could be explained by the following: by the time of the first SAR image taking (16 November), almost all the heavy fuel oil spilled had been washed ashore or had sunk. So, only those oil films remained on the sea surface that were hardly detectable from helicopter under the cloudy weather conditions without sunlight, though clearly visible at the SAR images.
6.4.2. Satellite monitoring of the Kerch Strait in summer 2008
Since many experts anticipated that heavy fuel oil sunk during the catastrophe in the Kerch Strait would rise up to the sea surface in the result of the water temperatures going up during a warmer time period, the area monitoring was carried out in spring-summer 2008.
No broad-scale pollution of the area to indicate any significant heavy fuel oil rise to the sea surface was detected during the satellite observations over the period. However, beginning from the second decade of June 2008, all the SAR images revealed the slicks typical of oil films, i. e., narrow dark bands having the same source location and stretching for several kilometers along the wind and current predominated at the time of imaging. The source of the slicks directly coincided with the location of the Volgoneft- 139 tanker bow part (Fig. 6.4.2a). Those slicks were clearly seen as well on the visual images obtained in the cloudless conditions by Landsat ETM+ (Fig. 6.4.2b, c). That pollution remained intense till 16 August 2008 when pumping of heavy fuel oil left in the tanker's bow was completed and the vessel was lifted and tugged to the port of Caucasus (Fig. 6.4.2d). The most interesting SAR images and analysis results were presented at http://www.iki.rssi.ru/asp/dep_moni. htm. The synopsis map of the Kerch Strait pollution in June-August 2008 shows the arrows indicating the wind speed and direction at the time of SAR imaging. Obviously, forced by the wind and current, film slicks drifted for distances of up to several kilometers playing, in a way, a role of tracer usable for a study of circulation processes in the Kerch Strait (Lavrova O. el ctl., 2009).

Figure 6.4.2. The Kerch Strait sea surface pollution with oil film in summer 2008. The satellite data obtained in .Time-August 2008 showing evidences of petroleum products resurfacing in the Kerch Strait. Oil products emerging on the surface of the ship sinking area (marked by asterisk) and spread by the wind and current to form thin threadlike oil slicks of 5-20 km long.
a) Envisat ASAR (30 km x 30 km), 17.06.08, 07:40 UTC (©ESA 2008), total slick length was 9 km.
b) Landsat ETM+ image (20 km x 20 km), 26.06.2008, 08:09 UTC, total slick length was 8 km.
c) Landsat ETM+ image (20 km x 20 km), 12.07.2008, 08:09 UTC, total slick length was 8 km.
d) Envisat ASAR (30 km x 30 km), 18.07.08,19:25 UTC (©ESA 2008), total slick length was 20km.
e) Envisat ASAR image (30 km x 20 km), 16.08.08, 07:54 UTC (©ESA 2008), showing oil slicks along the route of transportation of the wrecked oil tanker bow part. Oil slick was stretching from the Tuzla Island to the port of Caucasus. Some residual oil films were detected at the accident site
6.4.3. Satellite monitoring of oil pollution in the Kerch Strait region in 2009
Throughout the whole year 2009, monitoring of the Black Sea basin was conducted based on the synthetic aperture radar (SAR) data received from the European Space Agency rolling archive. The Kerch Strait region was a main point of focus in the course of that work. Although the archive contained the pre-ordered images of the region of interest only (that was not all the possible data received from all the satellites passes), the scope of available data was sufficient enough to draw certain conclusions.
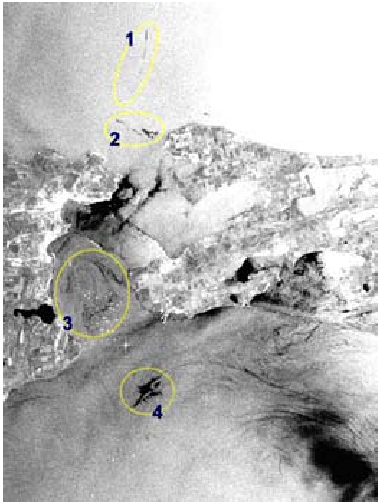
Fig. 6.4.3. Envisat ASAR acquired on 8 .Time 2009, at 07:50:44:
1 — oil/wastewater spill from a moving ship on ship route to the Kerch Strait; 2, 3 — oil/wastewater spills from ships at an¬chorage sites; 4 — algae bloom
During the year 2009, 107 SAR images (comprising 1-3 scenes each) featuring the Kerch Strait and its environs were analyzed. Out of them, 34 images were obtained by ERS-2 and 73 images — by the Envisat instruments. Most of the images (79) were of narrow 100 km swath, while 28 images had a swath of 400 km. Ground resolution (pixel size) was 75 m. The SAR data was analyzed and interpreted in combination with other available satellite and contact measurement data in order to increase the results reliability.
Environmental situation in the Kerch Strait region has always generated certain con¬cern in terms of contamination. Large ports and oil terminals, intense all-year-round tanker and cargo ship traffic, sea-based cargo re-loading practice were among the main potential negative factors. Oil pollution was constantly detected at the boat anchorage sites in the Northern and Southern sections of the Kerch Strait (Figure 6.4.3, circle 2 and 3), as well as along the ship routes in the Strait (Figure 6.4.3, circle 1). Those were largely deliberate discharges often performed illegally in the result of such routine tanker and ship operations discharges as oily ballast and tank water washing, fuel oil sludge, engine room wastes and foul bilge water. As to the core of the Kerch Strait, i. e., the area between the Tuzla Island and the Northern part of the Chushka Spit, it was often difficult there to differentiate oil from other anthropogenic pollution, and eutrophication (algal blooms) and wind-induced slicks.
6.4.4. Summary: Satellite monitoring on the Kerch Strait
Analysis of the available SAR data coupled with related auxiliary data has revealed that oil pollution in 2009 remained at the levels usual for the Kerch Strait region. There were no indications of either extreme pollution volumes or more intense pollution events having taken place during the year. Therefore, we may conclude, that the 2009 SAR observations brought no evidence of the 2007 severe storm aftereffects and the tanker catastrophe in the Kerch Strait.
Taking into account the complicated ecological situation in the Kerch Strait due to permanent anthropogenic pressure, in particular, extremely intense transportation of crude oil and oil products via the Strait, an urgent need should be mentioned to carry out a regular oil spill monitoring in the area complimented with remote sensing observations.
Chapter 7. Other Pollutants In The Kerch Strait
Chasovnikov V., Nasurov A., Korshenko A., Ermakov V., Zhugailo S., Eremeev V., Ivanov V., Ilyin Yu., Khmara T., Komorin V., Orlova I., Denga Yu., Stokozov N., Malakhova L., Kostova S., Mirzoeva N., Kotelianets E.
7.1. Observations carried out prior to the Kerch Strait accident
7.1.1. UA: YugNIRO. Trace metals present in the bottom sediments in 1995-2000
7.2. The post-disaster observations
7.2.1. RU: ChAD. Sulphur content of bottom sediments in July, August, November and December 2008
7.2.2. UA: MHI. Pollutants present in the water and bottom sediments in December 2007 and March 2008
7.2.2.1. Chlorinated hydrocarbons
7.2.3. UA: UkrSCES. July and December 2009, the Kerch Strait (the V.Parshin RV 30th and 31st cruises)
7.2.3.1. Chlorinated hydrocarbons in bottom sediments
7.2.3.2. Trace metals
7.2.4. UA: IBSS. Pollutants present in the water and bottom sediments in December 2007 and December 2009
7.2.4.1. Chlorinated hydrocarbons
7.2.4.2. Trace metals (mercury)
7.2.4.3. Long–lived radionuclides
7.3. Hydrochemical Index of Water Pollution (IWP)
7.4. Summary: Other pollutants in the Kerch Strait
7.1. Observations carried out prior to the Kerch Strait accident
7.1.1. UA: YugNIRO. Trace metals present in the bottom sediments in 1995-2000
During the period of 1995-2000, average concentrations of manganese, copper, lead, chromium and mercury in the Kerch Strait bottom sediments remained at the background level established for the area (Mytropolsky A.Yu., Bezborod A.A., Ovsyanyi E.I., 1982). On the contrary, high concentrations of arsenic, cadmium, zinc and iron were registered. Due to the anthropogenic influence, arsenic content had visibly increased in the Kerch Strait in the late 1990s compared to the previously investigated periods and its annual average varied in the range of 20.5-42.5 μg/g of dry weight (background value is 11 μg/g), (Zhugailo S.S. et al., 2008). However, a generally decreasing trend of the Kerch Bight water column and bottom sediments pollution by trace metals was observed in the period from 1995 to 2000.
7.2. The post-disaster observations
7.2.1. RU: ChAD. Sulphur content of bottom sediments in July, August, November and December 2008
More than 6,500 tons of sulphur was washed out after the vessels accident in November 2007 on the Kerch Strait. Following up on it, Rosprirodnadzor carried out in July/August, November and December in 2008 several expeditions at 150 Kerch Strait stations to study the sulphur presence in the bottom sediments upper layer.
Certain similarities were found in the sulphur and TPHs distribution patterns in the bottom sediments (Fig. 7.2.1a).
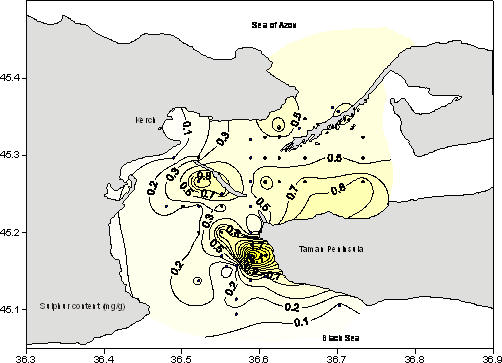
Fig. 7.2.1a. Sulphur content (mg/g) of the Kerch Strait bottom sediments in summer 2008.
In 2008, sulphur concentrations were exceeding their typical values at a large bottom area of the Kerch Strait with the maximal values detected in summer (Table 7.2.1a). The maximal sulphur concentration recorded in July-August stood at an extremely high level of 2.87 mg/g (almost 18- fold higher than MAC, as MAC for Sulphur was equal to 0.16 mg/g, according to the Russian State Normative 2.1.7.2041-06). The values observed in November-December 2008 were much lower.
In July-August 2008, sulphur and TPHs were found accumulated in the vicinity of the Taman Peninsula South-Western part, i.e., between the Panagia and Tuzla Capes, and in the Southern direction from the Enikale Cape in the Crimea area.
Table 7.2.1a. Statistical parameters of sulphur concentration (mg/g) in the Kerch Strait bottom sediments in 2008.
| number of stations | min | max | range | average | standard deviation | >MAC/%* | |
| Stage 1. July - August | |||||||
| sulphur | 43 | 0.08 | 2.87 | 2.79 | 0.5198 | 0.5271 | 40/93% |
| Stage 2. November | |||||||
| sulphur | 71 | 0.01 | 0.43 | 0.42 | 0.205 | 0.0978 | 45/63% |
| Stage 3. December | |||||||
| sulphur | 36 | 0.02 | 0.67 | 0.65 | 0.267 | 0.177 | 25/69% |
Note: >MAC/%* (e.g. 40/93%) stands for the number and percentage of stations where sulphur concentration was exceeding MAC.
The autumn maximal value was almost 7-fold lower than in summer (Fig. 7.2.1b). In November, a high sulphur concentration area covered the Taman Bay and the Kerch Strait area in the proximity of the Kerch Bay, as well as the northwards to the Tuzla Island. Thus, 63% of sediment samples had revealed sulphur concentrations exceeding the normative value.
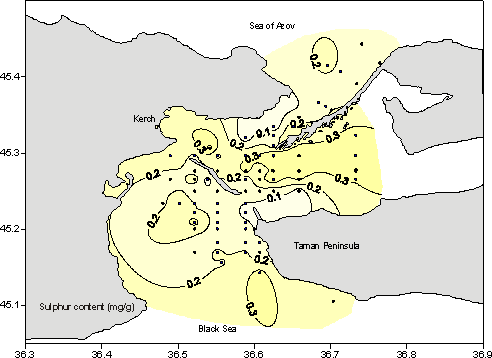
Fig. 7.2.1b. Sulphur content (mg/g) of the Kerch Strait bottom sediments in November 2008.
In December, the average and maximal sulphur concentrations registered were slightly increased in comparison with those recorded in November, while their spatial distribution had somehow changed. The high concentration areas with levels >0.6 mg/g i.e., about 4-times higher than 1 MAC, had emerged southwards to the Tuzla Island (Fig. 7.2.1c) and within the Taman Bay (the same as in the previous month). The minimal sulphur concentration was detected at the Kerch Strait exit to the Black Sea.
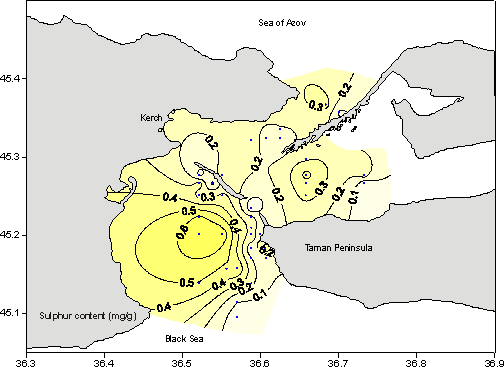
Fig. 7.2.1c. Sulphur concentration (mg/g) of the Kerch Strait bottom sediments in December 2008.
Sulphur content was exceeding MAC at 69% of stations surveyed in December 2008 (Fig. 7.2.1d).
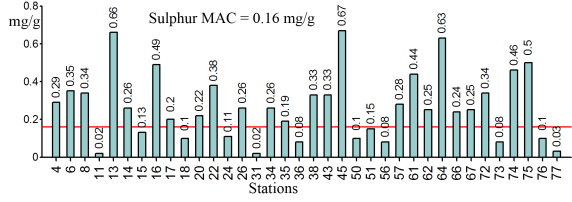
Fig. 7.2.1d. Sulphur concentration (mg/g) of the Kerch Strait bottom sediments in December 2008.
In conclusion, the average July, November and December 2008 sulphur concentrations were exceeding MAC by 3.25, 1.3 and 1.67 times, respectively. Those sulphur concentrations varied in the range of 0.01 mg/g -2.87 mg/g, with an average value of 0.31 mg/g. The maximal concentration was exceeding MAC by 18 times. High sulphur concentrations observed in the bottom sediments of the Kerch Strait in 2008 had most likely directly resulted from the Kerch Strait accident on 11 November 2007.
7.2.2. UA: MHI. Pollutants present in the water and bottom sediments in December 2007 and March 2008
MHI UNAS (Sevastopol) conducted on 6-9 December 2007 and in March 2008 two expeditions to study pollution of the water and bottom sediments of the Kerch Strait (map of stations is given in Subchapter 6.1: Fig. 6.1.7a). Petroleum hydrocarbons (Chapter 6), chlorinated hydrocarbons and trace metals were investigated during that study.
7.2.2.1. Chlorinated hydrocarbons
7.2.2.1.1. Water column
In December 2007, the chlorinated pesticides concentration in the surface layer was varying in a wide range (Table 7.2.2a).
Table 7.2.2a. Chlorinated hydrocarbons concentration (ng/l) in the Kerch Strait surface waters in December 2007.
| parameter, ng/l | Range | average | the maximal values location |
| Lindane | 0.003-2.52 | 0.58 | vicinity of the Tuzla Island |
| Heptachlor | 3.55-10.23 | 6.93 | the Kerch Strait entrance to the Azov Sea |
| pp-DDT | 1.10-12.19 | 5.00 | the Kerch Strait central part |
| pp-DDE | 1.48-4.34 | 2.64 | |
| pp-DDD | 0.24-4.37 | 2.61 |
All chlorinated pesticides had formed rather high concentrations that were often exceeding the maximum allowed quantity (Fig. 7.2.2a).
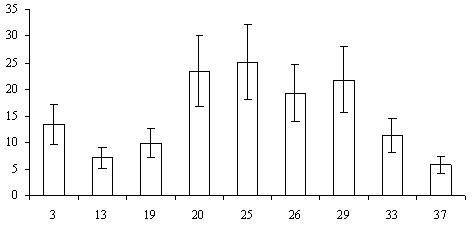
Fig. 7.2.2a. The total chlorinated pesticides concentration (ng/l) in the Kerch Strait surface waters on 6–9 December 2007. (The station numbers (see also Fig. 6.1.7a) are given at axis x).
Within the area under review, concentrations of all investigated individual PCBs were lower than 4 ng/l (Fig. 7.2.2b), whereas the MAC is 10 ng/l.
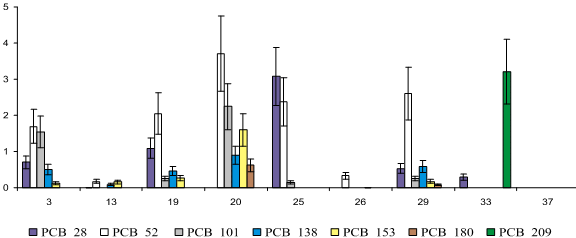
Fig. 7.2.2b. PCBs concentrations (ng/l) in the Kerch Strait surface waters on 6–9 December 2007. (The station numbers (see also Fig. 6.1.7a) are given at axis x).
In March 2008, γ-HCH (lindane) and all forms of DDT group were registered in the Kerch Strait (Table 7.2.2b). Pollutants concentration recorded was 5-20 times lower than in December 2007.
Table 7.2.2b. Chlorinated pesticides concentration (ng/l) in the Kerch Strait surface waters in March 2008.
| parameter, ng/l | Range | average | the maximal values location |
| Lindane | 0.04-0.25 | 0.11 | by the Tuzla Island Western end |
| Heptachlor | 0.12-0.73 | 0.37 | - |
| DDT | 0.18-1.13 | 0.57 | by the Tuzla Island Western end |
| DDE | 0.04-3.65 | 0.57 | the Kerch Strait Southern entrance to the Black Sea |
| DDD | 0.08-2.64 | 0.67 | |
| PCBs | 0.00-2.00 | 1.09 | the Kerch Strait Southern entrance to the Black Sea |
In March 2008, PCBs concentration was rather low and within 2 ng/l, while the average value was 1.09 ng/l. That corresponded to the “unpolluted water” quality class according to the World Health Organization, WHO (1980) classification. The individual congeners #52, #101, #138, #153 and #180 were distributed rather unevenly within the studied area and their concentration was significantly lower than in December 2007 (Fig. 7.2.2c).
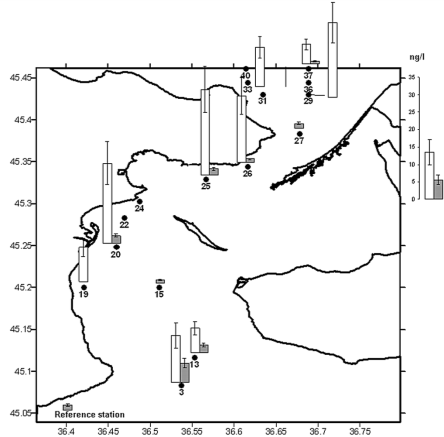
Fig. 7.2.2c. Distribution of PCBs (ng/l) in the Kerch Strait surface waters in December 2007 (white) and in March 2008 (grey).
7.2.2.1.2. Bottom sediments
In December 2007, the chlorinated pesticides content in the Kerch Strait sediments was insignificant and was as low as 1.84 ng/g and 1.57 ng/g at two out of eight stations observed (Stations 19 and 22 accordingly, central part of the Strait). PCBs were present at all stations though in low concentration. Within that class of pollutants, the congeners #138 (from 0.11 to 1.69 with the average of 0.84 ng/g) and #153 (0.13-2.39, the mean was 1.16 ng/g) were distributed wider. The PCBs total concentration was reaching the levels of 7.78 ng/g at Station 27 and 7.51 ng/g at Station 33 at the Kerch Strait Northern entrance (Fig. 7.2.2d), and those levels were about 3 times lower the permitted concentration of 20 ng/g (Warmer H., van Dokkum R., 2002, “Niederlandische Liste”) accepted as a norm for the Black Sea sediments.

Fig. 7.2.2d. PCBs (ng/g) total concentration per station in the Kerch Strait bottom sediments on 6–9 December 2007.
The polychlorobyphenyls spatial distribution in both the water column and the bottom sediments was characterized by the elevated concentrations present in the Kerch Strait middle part and in the vicinity of the Kerch port (at Station 20), as well as at the Northern entrance stations (Station 27 and Station 33). Those areas were quite close to the boat routes and presence of various pollutants discharged by the vessels on random, during the maintenance or resulting out of small accidents was typical for them.
In March 2008, chlorinated pesticides from the DDT group were detected in the sediments at all stations. DDT was dominating in comparison with its metabolites whose presence was taken for a sign of the pesticides fresh input into the ecosystem. Among the seven tested individual PCBs, the congeners #101, #138, #153, #180 and #209 were found in the bottom sediments and their average concentration was registered as 3.06 ng/g (Emelianov V.A. et al, 2004), nearly 7 times lower the PC of 20 ng/g.
7.2.2.2. Trace metals[12] in bottom sediments
An important source of trace metals in the Kerch Strait are the ports, moorages, coastal industrial and municipal installations, as well as certain damping sites located close to the Kerch Strait entrance (Petrenko O.A., Sebah L.K., Fashchuk D.Ya., 2002; Zhugailo S.S., Petrenko O.A., 2009).
On 6-9 December 2007, the most common trace metals concentrations in the Kerch Strait bottom sediments were registered below the Detection Limit of Cu < 20·10-4 %, Co < 10·10-4 %, Pb < 25·10-4 % and As < 20·10-4 %. As for Ni, Co, Fe, Cr, V and As, local patches were recorded having these metals in rather high concentrations. Most probably the bottom sediments granulometric and chemical composition (for example, the percentage of muddy particles or organic matter), and the water circulation were the most important factors for formation of such local patches.
In March 2008, the trace metals spatial distribution was following their pattern observed in winter (Fig. 7.2.2e). Significant gradients of concentrations across the Kerch Strait were typical for all metals revealing extreme values at the central axis line of Cr (Fig. 7.2.2e) and within the coastal zone of Sr (Fig. 7.2.2f).
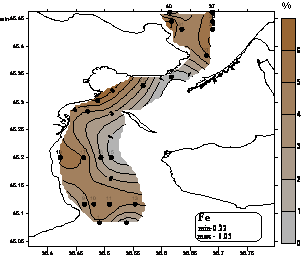

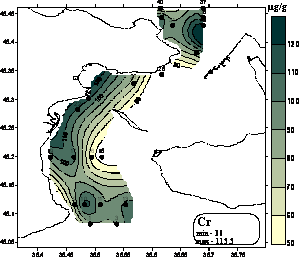
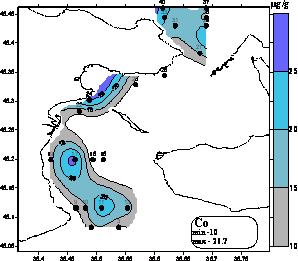
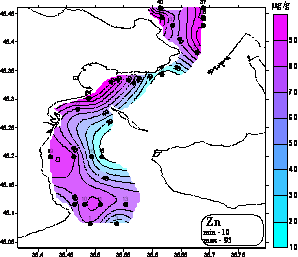


Fig. 7.2.2e. Various trace metals (μg/g) spatial distribution in the Kerch Strait bottom sediments in March 2007.
The patchiness of trace metals is largely formed by the Kerch Strait dominant currents and the size spectrum of the bottom sediments particles, as mentioned above. Spring distributions of chromium (av. 93 μg/g and max. 115.5 μg/g) and zinc (av. 61 μg/g and max. 95 μg/g) were similar, with maxima registered in the Kerch Strait Northern part. It was revealed that concentrations had decreased slightly moving southwards and significantly in the central zone. Zinc distribution presented much more patchiness than the chromium. The mean content of nickel in the bottom sediments was 29.14 μg/g and the maximum of 50.0 μg/g was recorded in the Kerch Strait Northern coastal part. The maximal value was exceeding its average by 72% indicating patchiness in the nickel distribution. The nickel general concentration in the Kerch Strait bottom sediments was rather low and close to background levels of unpolluted areas.
Titanium and iron distributions were similar revealing their minimal quantities in the Kerch Strait central part and high concentrations within the coastal zone. The mean concentration of titanium oxide was 0.6% and the maximum – 0.78%, while for the iron oxide those concentrations were 3.78% and 6.05% respectively. Their quantities content was similar to the registered for the Black Sea shelf unpolluted areas.
Unlike other metals, strontium was concentrated in the central part of the Kerch Strait (Fig. 7.2.2f) and its mean level was 366.25 μg/g and the maximal quantity - 1125 μg/g. The mean and maximal values ratio was exceeding 200% that could be interpreted as evidence of the metal patchy distribution.
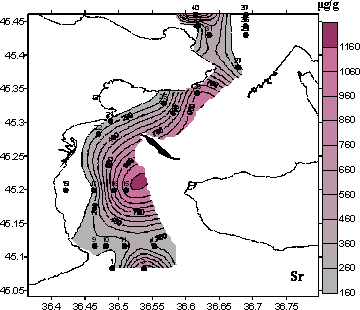
Fig. 7.2.2f. Strontium (μg/g) distribution in the Kerch Strait bottom sediments in March 2008.
7.2.3. UA: UkrSCES. July and December 2009, the Kerch Strait (the V.Parshin RV 30th and 31st cruises)
7.2.3.1. Chlorinated hydrocarbons in bottom sediments
In July and December 2009, respectively, 12 and 23 samples of bottom sediments were collected for analysis of the chlorinated pesticides and polychlorinated biphenyls content. The average concentrations of individual pesticides in sediments did not exceed 1 PC (Tab. 7.2.3a, Tab. 7.2.3b, Fig. 7.2.3a).
Table 7.2.3a. Statistical characteristics of the chlorinated pesticides concentration in the Kerch Strait bottom sediments on 8 July 2009 (the V.Parshin RV 30th cruise). In bold the numbers exceeding 1 PC are marked.
| Pesticides, ng/g | α-HCH | β-HCH | g-HCH (Lindane) | HCB | Heptachlor | Aldrine |
| Average value | 0.11 | 0.43 | 0.02 | 0.53 | 0.52 | 0.24 |
| Minimum | <0.05 | <0.05 | 0.02 | <0.05 | <0.05 | <0.05 |
| Maximum | 0.74 | 3.22 | 0.02 | 0.70 | 5.12 | 1.59 |
| PС | 2.5 | 1.0 | 0.05 | 2.5 | 2.5 | 2.5 |
Table 7.2.3b. Statistical characteristics of the chlorinated hydrocarbons concentration in the Kerch Strait bottom sediments on 8-11 December 2009 (the V.Parshin RV 31th cruise). In bold the numbers exceeding 1 PC are marked.
| Pesticides, ng/g | α-HCH | -HCH | g-HCH (Lindane) | HCB | Hepta-chlor | Aldrine | Endrin | Dieldrin |
| Average value | 0.32 | 2.25 | 0.37 | 0.16 | 1.08 | 0.15 | 0.17 | 0.40 |
| Minimum | 0.10 | 0.88 | 0.12 | 0.10 | 0.10 | <0.05 | <0.05 | 0.11 |
| Maximum | 0.62 | 3.68 | 0.66 | 0.32 | 7.34 | 0.80 | 2.08 | 0.83 |
| PС | 2.5 | 1.0 | 0.05 | 2.5 | 2.5 | 2.5 | 1.0 | 0.5 |
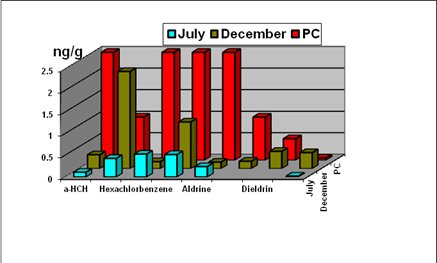
Fig. 7.2.3a. Average concentration of chlorinated pesticides in the bottom sediments of the Kerch Strait in 2009.
The exception was for lindane and its β-isomer, their average concentrations in December 2009 exceeded PC, but the average concentration of the sum of hexachlorcyclohexane isomers was below 1 PC (Fig. 7.2.3b). The average level of DDT and its metabolites in this study area in 2009 was above the prescribed standard.
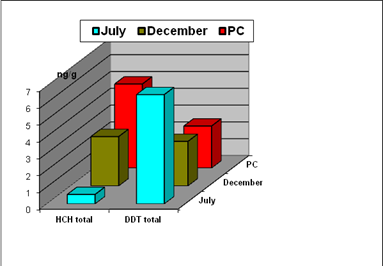
Fig. 7.2.3b. Average concentration of sums DDT and HCH in the bottom sediments of the Kerch Strait in 2009.
Amount of PCBs in relation to the standards of Ar-1254 and Ar-1260 were determined in December 2009. The results indicated a fairly high level of accumulation of those toxic compounds in bottom sediments of the Kerch Strait (Fig.7.2.3.c).
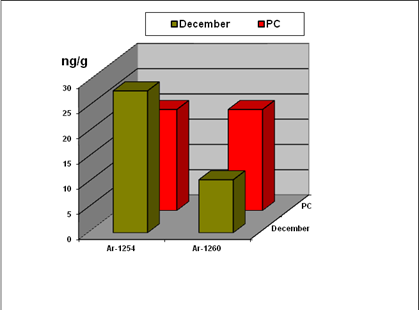
Fig. 7.2.3c. Average concentrations of total PCBs in the bottom sediments of the Kerch Strait in 2009.
7.2.3.2.1. Water column
In 2009, observations were carried out at 8 stations in July and 25 stations in December (see a map of stations in Chapter 5, Fig. 5.2.5.1a and Fig. 5.2.5.2b) and they revealed the trace metals presence in concentrations almost ten times lower than MAC (Tab. 7.2.3c and d, Fig. 7.2.3d).
Table 7.2.3c. Statistical characteristics of Trace metals (μg/l) in the Kerch Strait surface waters on 8 July 2009.
| Trace metals, μg/l | Cd | Hg | Cu | Pb | Cr | Zn | As |
| Average value | 0.07 | 0.01 | 1.2 | 0.6 | 0.6 | 7.8 | 1.8 |
| Minimum | 0.05 | 0.01 | 0.5 | 0.5 | 0.5 | 1.1 | 1.0 |
| Maximum | 0.10 | 0.019 | 2.4 | 0.9 | 0.8 | 15.3 | 3.1 |
| MAC | 10 | 0.1 | 5 | 10 | 5 | 50 | 10 |
Table 7.2.3d. Statistical characteristics of trace metals (μg/l) in the Kerch Strait surface waters in December 2009.
| Trace metals, μg/l | Cd | Hg | Cu | Pb | Cr | Zn | As |
| Average value | 0.06 | 0.01 | 1.3 | 1.1 | 0.5 | 4.3 | 1.0 |
| Minimum | 0.05 | 0.01 | 0.4 | 1.0 | 0.5 | 1.2 | 1.0 |
| Maximum | 0.13 | 0.01 | 3.4 | 1.9 | 0.5 | 13.8 | 1.0 |
| MAC | 10 | 0.1 | 5 | 10 | 5 | 50 | 10 |

Fig. 7.2.3d. Trace metals concentration in the surface waters of the Kerch Strait in 2009.
7.2.3.2.2. Bottom sediments
The bottom sediments samples were taken at 12 stations in July and 23 stations in December 2009 and the trace metals content detected therein was largely lower 1 MAC. In a couple of cases in July only nickel, copper and chromium were exceeding the MAC values (Tab. 7.2.3e). The metals content in the bottom sediments was within the typical range for the region.
Table 7.2.3e. Statistical characteristics of the trace metals concentration in the Kerch Strait bottom sediments on 8 July 2009 (the V.Parshin RV 30th cruise). In bold the numbers exceeding 1 PC are marked.
| Trace metals, μg/g | Cd | Co | Hg | Cu | Pb | Cr | Zn | As | Ni |
| Average value | 0.130 | 6.4 | 0.036 | 20.5 | 21.7 | 66.6 | 70.2 | 9.8 | 22.0 |
| Minimum | 0.063 | 3.0 | 0.011 | 4.8 | 14.9 | 16.3 | 32.8 | 4.4 | 10.8 |
| Maximum | 0.226 | 10.4 | 0.056 | 55.6 | 30.7 | 108 | 111 | 14.7 | 40.3 |
| PC | 0.8 | 20 | 0.3 | 35 | 85 | 100 | 140 | 29 | 35 |
Trace metals investigated in December 2009 revealed the presence of cadmium, cobalt, mercury, copper, lead, chromium, zinc, arsenic, nickel and aluminum. The chromium and nickel maxima were slightly exceeding the norms (Tab. 7.2.3f), while the average values during 2009 were significantly lower (Fig 7.2.3e).
Table 7.2.3f. Statistical characteristics of the trace metals concentration in the Kerch Strait bottom sediments on 8-11 December 2009. In bold the numbers exceeding 1 PC are marked.
| Trace metals, μg/g | Cd | Co | Hg | Cu | Pb | Cr | Zn | As | Ni |
| Average value | 0.147 | 10.7 | 0.032 | 15.7 | 16.1 | 65.9 | 60.4 | 8.6 | 23.7 |
| Minimum | 0.090 | 3.1 | 0.010 | 3.2 | 7.6 | 15.7 | 19.0 | 4.4 | 7.1 |
| Maximum | 0.262 | 17.2 | 0.066 | 31.8 | 28.2 | 112 | 120 | 23.5 | 43.1 |
| PС | 0.8 | 20 | 0.3 | 35 | 85 | 100 | 140 | 29 | 35 |

Fig. 7.2.3e. Trace metals concentration in the bottom sediments of the Kerch Strait in 2009.
7.2.4. UA: IBSS. Pollutants present in the water and bottom sediments in December 2007 and December 2009
To determine organochlorine compounds, mercury and long-lived radionuclides in the water and bottom sediments, the IBSS Department of Radiation and Chemical Biology collected samples at ten stations of the Kerch Strait region on 16 December 2007 (the map of stations is shown in Subchapter 6.2, Fig. 6.2.4a). IBSS carried out the next Kerch Strait expedition during December 2009 and studied the chlorinated organics concentration present in the bottom sediments.
7.2.4.1. Chlorinated hydrocarbons
The polychlorinated biphenyls (PCBs) contaminants originating sources is industrial activity like ship exploitation and maintenance within the Kerch Bay and in the Kerch Strait, while organochlorine pesticides (DDTs) come from agriculture (Fedorov, 1999; Li et al., 2006). The organochlorine compounds concentration was measured in the surface sea waters (December 2007) and in the bottom sediments surface layer (0–5 cm), (December 2007 and December 2009). The organochlorine pesticides and PCBs analysis was conducted according to the standard methods applicable (Oradovsky S.G., 1993, Methodic Guidelines: Detection of pollutants in bottom sediments samples and on suspended solids, 1996). The organochlorine residues quantification was done through using the Varian 3800 gas chromatograph equipped with the 63Ni electron capture detector and capillary column. The measurement errors were estimated as 15% of the bottom sediment samples and as 28% of the water samples. The quality assurance criteria were applied prior to the samples analysis. The inter-comparison exercises undertaken in the frameworks of the International Atomic Energy Agency Program (MESL/IAEA–159, 2007) have given satisfactory results.
In December 2007, DDT and metabolites was determined present in water at six stations. The pesticides concentrations varied in the range of 1.26-4.07 ng/l, while 1 MAC was equal 10 ng/l (Tab. 7.2.4a).
Table 7.2.4a. DDTs and PCBs concentrations in the Kerch Strait surface waters in December 2007.
| organochlorine compounds | Stations | |||||||
| K–1 | K–2 | K–3 | K–4 | K–5 | K–6 | K–7 | K–8 | |
| organochlorine pesticides, ng/l | ||||||||
| p,p’–DDE | – | – | – | – | 3.55 | – | 2.94 | 1.80 |
| p,p’–DDD | 1.26 | 2.47 | – | – | – | – | – | – |
| p,p’–DDT | 2.87 | 4.07 | – | – | – | 2.60 | – | – |
| polychlorinated biphenyls, ng/l | ||||||||
| # 28 | 4.86 | 3.71 | 1.03 | 0.56 | 2.42 | 1.45 | 5.74 | – |
| # 52 | 3.79 | 6.32 | 0.13 | 7.65 | 4.57 | – | 8.93 | 8.81 |
| # 101 | 1.73 | 4.68 | 2.70 | 2.08 | 5.51 | 0.75 | 2.41 | 2.74 |
| # 138 | 0.96 | 1.81 | 4.48 | 5.68 | 0.76 | 1.29 | 3.76 | 3.95 |
| # 153 | 0.85 | 2.49 | 6.76 | 1.58 | 1.09 | – | 3.94 | 5.16 |
| # 180 | – | – | – | 2.21 | – | – | 5.59 | 1.44 |
| # 209 | – | – | – | 0.20 | – | – | 1.10 | 2.55 |
| ΣPCB | 12.18 | 19.00 | 15.10 | 19.97 | 14.34 | 3.50 | 31.46 | 24.65 |
Note: "–" mean below Detection Limit
For the PCBs pollution indicators, seven congeners suggested by the International Council for Exploration of the Sea, i.e., ## 28, 52, 101, 118, 138, 153 and 180 (Duinker et al., 1988) were selected. In December 2007, polychlorinated biphenyls (PCBs) high content was registered in the Kerch Strait surface waters. Total concentrations of seven PCBs congeners (##28, 52, 101, 138, 153, 180 and 209) varied from 3.50 ng/l to 31.46 ng/l and exceeded 3 MAC (Tab. 7.2.4a and Fig. 7.2.4a). That could be attributed to forbidden boat fuel tanks washing and ballast waters discharges or directly linked to the vessels sunk in the result of the storm in November 2007.
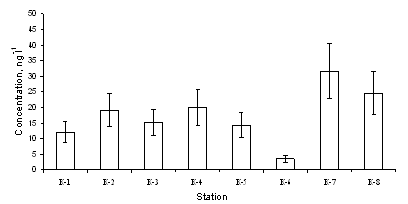
Fig. 7.2.4a. The PCBs congeners total concentration in the Kerch Strait surface waters in December 2007
In December 2007, the PCBs presence was determined in the bottom sediments at all stations, but in low concentration. Their content ranged from 0.41 ng/g to 1.39 ng/g of dry weight and those levels were much lower 1 PC of 20 ng/g (Warmer H., van Dokkum R., 2002, “Niederlandische Liste”), (Tab. 7.2.4b). The PCBs concentration in the Kerch Strait bottom sediments was substantially lower in comparison to the IBSS indicators obtained at the Sevastopol and Balaklava Bights, as well as at the Feodosiya harbor.
Table 7.2.4b. DDTs and PCBs concentrations in the Kerch Strait bottom sediments in December 2007.
| organochlorine compounds | Stations | |||||||||
| К–1 | К–2 | К–3 | К–4 | К–5 | К–6 | К–7 | К–8 | К–9 | К–10 | |
| organochlorine pesticides, ng/g of dry weight | ||||||||||
| p,p’–DDE | 0.69 | 0.61 | 0.72 | 1.35 | 0.19 | 0.12 | 0.42 | 1.05 | 0.37 | 0.49 |
| p,p’–DDD | 0.22 | 0.09 | 0.68 | 1.43 | 0.11 | 0.80 | 0.49 | 2.12 | 0.69 | 27.69 |
| p,p’–DDT | – | – | 0.31 | 2.15 | 0.54 | – | 0.44 | – | – | – |
| ΣDDT | 0.91 | 0.7 | 1.71 | 4.13 | 0.84 | 0.92 | 1.35 | 3.17 | 1.06 | 28.18 |
| polychlorinated biphenyls, ng/g of dry weight | ||||||||||
| # 101 | 0.50 | 0.27 | 0.09 | 0.74 | 0.06 | 0.20 | 0.27 | 0.39 | 0.05 | 0.20 |
| # 138 | 0.03 | 0.12 | 0.11 | 0.03 | 0.04 | 0.13 | 0.25 | 0.05 | 0.28 | 0.10 |
| # 153 | 0.30 | 0.21 | 0.19 | 0.35 | 0.10 | 0.44 | 0.37 | 0.58 | 0.57 | 0.32 |
| # 180 | 0.06 | – | 0.02 | – | 0.04 | 0.15 | 0.16 | 0.11 | – | 0.07 |
| # 209 | – | – | – | – | 0.08 | 0.09 | 0.11 | 0.27 | – | – |
| ΣPCB | 0.89 | 0.60 | 0.41 | 1.12 | 0.33 | 1.01 | 1.16 | 1.39 | 0.89 | 0.69 |
Note: "–" mean below Detection Limit
In December 2009, the DDT group organochlorine pesticides and five PCBs congeners (##101, 138, 153, 180 and 209) were found present in the Kerch Strait sediments at all stations (Fig. 7.2.4b). DDE and DDD dominated in comparison with DDT. Total concentrations of five PCBs congeners (##101, 138, 153,180 and 209) ranged from 0.43 ng/g of dry weight to 23.56 ng/g, while their maximum was exceeding permissible concentrations. Their averaged concentration equaled 2.14 ng/g of dry weight, while its minimum was detected in the sandy sediments. In general, the PCBs registered concentration was significantly higher than two years earlier, whereas the DDTs pesticides levels were about three times lower.
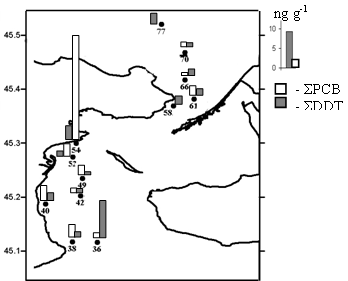
Fig. 7.2.4b. The sampling sites location and distribution of total PCBs (white bars) and total DDTs (grey bars) in the Kerch Strait bottom sediments in December 2009.
7.2.4.2. Trace metals (mercury)
7.2.4.2.1. Surface water
The mercury concentration maximum (15.43 ng/l) measured in the Kerch Strait surface waters in December 2007 (Tab. 7.2.4c) slightly exceeded (by 15%) the maximal allowed concentration (MAC List, 1999). That level was substantially lower in comparison with the IBSS detected levels in 1999-2004 for the same region, i.e., 62-80 ng/l in the surface waters and 20-28 ng/l in the near bottom waters with predomination of dissolved mercury (Kostova S.K., Popovichev V.N., 2002).
7.2.4.2.2. Bottom sediments
Mercury concentration in the Kerch Strait bottom sediments in December 2007 varied from 2.3 ng/g to 9.8 ng/g of dry weight (Tab. 7.2.4c). Those concentrations were considerably lower in comparison with the usually acceptable mercury natural maximal content for the shelf bottom sediments (100 ng/g of dry weight) and definitely much lower its norm of 300 ng/g (Warmer H., van Dokkum R., 2002).
Table 7.2.4c. Mercury concentrations in the Kerch Strait surface waters, suspended solids and bottom sediments in December 2007.
| Station | water, ng/l | particles,ng/g of dry weight | bottom sediments, ng/g | ||||
| dissolvedphase | particlesphase | Total | wet weight | dry weight | |||
| К–1 | 1.0 | 2.38 | 3.38 ± 0.22 | 9.50 ± 1.29 | 2.56 ± 0.35 | 6.94 ± 0.94 | |
| К–2 | 2.0 | 13.43 | 15.43 ± 0.99 | 60.80 ± 8.27 | 3.46 ± 0.47 | 9.80 ± 1.34 | |
| К–3 | 6.0 | 2.90 | 8.90 ± 0.57 | 11.79 ± 1.60 | 4.37 ± 0.59 | 9.40 ± 1.28 | |
| К–4 | 2.0 | 3.46 | 5.46 ± 0.35 | 14.38 ± 1.96 | 1.98 ± 0.27 | 2.28 ± 0.31 | |
| К–5 | 3.0 | 0.24 | 3.24 ± 0.22 | 0.87 ± 0.12 | 1.85 ± 0.27 | 2.63 ± 0.36 | |
| К–6 | 1.0 | 5.45 | 6.45 ± 0.40 | 44.76 ± 6.10 | 2.92 ± 0.40 | 7.59 ± 1.00 | |
| К–7 | 3.0 | 1.72 | 4.72 ± 0.30 | 11.08 ± 1.51 | 2.67 ± 0.36 | 6.27 ± 0.85 | |
| К–8 | 1.0 | 3.20 | 4.20 ± 0.27 | 15.00 ± 2.00 | 3.25 ± 0.44 | 7.80 ± 1.10 | |
| К–9 | – | – | – | – | 2.47 ± 0.34 | 6.40 ± 0.87 | |
| К–10 | – | – | – | – | 2.24 ± 0.30 | 8.15 ± 1.10 | |
Note: "–" mean below Detection Limit
7.2.4.3. Long–lived radionuclides
The 137Cs and 90Sr anthropogenic long-lived radionuclides have primarily originated from the large-scale atmospheric nuclear weapon tests conducted prior to the 1963 test-ban treaty conclusion. The Chernobyl Nuclear Power Plant (NPP) Accident in April 1986 contributed additional direct radioactive contamination through their fallouts onto the Black Sea surface and indirect contamination through atmospheric release and deposition of radionuclides on the drainage basin with the further runoff to enter into the sea. (Polikarpov G.G. et al., 2008). It should be noted that 137Cs and 90Sr are the especially conservative elements while in the marine environment, but those radionuclides could reveal considerable sedimentation in the coastal and estuarine zones.
The gamma spectrometric measurements of 137Cs activities in the bottom sediment samples were made by using a high-purity germanium (HPG), ORTEC GMX–10 detector and the reference samples obtained from the IAEA Monaco Marine Environmental Laboratory. Determination of 90Sr activities in the bottom sediment samples was carried out in compliance with the chemical procedure described accordingly (Harvey B.K. et al., 1989) and following up on the measurements made through using the Quantulus-1220 ultra low-level liquid scintillation beta-counter.
The 137Cs activity in the Kerch Strait bottom sediments in December 2007 varied from 18 Bq/kg to 54 Bq/kg of dry weight (Fig. 7.2.4c) and was partially dependent on the bottom sediments composition. The 137Cs maximal concentrations in the Kerch Strait bottom sediments were less essential in comparison with the IBSS levels registered in 1998–2000 in the Dnieper and Danube Rivers estuarine zones, i.e., ~ 150 Bq/kg and 250–300 Bq/kg of dry weight respectively (Gulin S.B. et al., 2002).
The 90Sr activity in the Kerch Strait bottom sediments in December 2007 was considered negligible, i.e., ~ 0.6 Bq/kg – 4.4 Bq/kg of dry weight (Fig. 7.2.4d), in comparison with the 1997–2000 IBSS registered levels of ~ 150 Bq/kg of dry weight that were close to the levels produced by the 90Sr main source of discharge into the Black Sea after the Chernobyl NPP accident, i.e., of the Dnieper River (Mirzoeva N.Yu. et al., 2005).
Up till now the 137Cs and 90Sr long-lived radionuclides local sources at the Black Sea and the Kerch Strait specifically remain undiscovered.

Fig. 7.2.4c,d. The 137Cs and 90Sr activities in the Kerch Strait bottom sediments in December 2007.
7.3. Hydrochemical Index of Water Pollution (IWP)
Water Quality Zoning of the area studied was done by ChAD (Novorossiysk). It was based on the water pollution complex index (IWP) calculated through using the data provided by several 2008 expeditions assigned with a task of carrying out an ecological assessment of the Kerch Strait, and the Black and Azov Seas marine environment condition status after the 11 November 2007 shipwreck (see Chapter 6.1.12). IWP was calculated for different seasons, as well as for the surface and bottom layers. For IWP calculating, besides the compulsory dissolved oxygen values (MinAC 6.00 mg/l), those of the phosphates (MAC 0.15 mg/l), ammonia (MAC 2.9 mg/l) and petroleum hydrocarbons (MAC 0.05 mg/l) concentrations were used as well.
IWP is the index most frequently applied by the former Soviet Union countries for the marine water quality assessment (MR, 1988). It uses the average concentration values of a limited number of the most important pollutants for the area in question. For marine waters, four parameters are considered and IWP is calculated as:

where Сi is concentration of three major pollutants and dissolved oxygen. This concentration is divided by the Maximum Allowed Concentration. Thus, the marine environment index is calculated as an average of 4 indicators, i.e., of oxygen and three pollutants that are quite likely to exceed the maximum allowed concentration. A constant parameter present in this calculation is the dissolved oxygen value. The water bodies quality is unitized into classes depending upon the IWP value (Table 7.3a).
Table 7.3a. The water quality classes based on a complex Index of Water Pollution(IWP).
| the water quality classes | the IWP range | |
| very clean | I | IWP < 0.25 |
| clean | II | 0.25 < IWP £ 0.75 |
| moderately polluted | III | 0.75 < IWP £ 1.25 |
| polluted | IV | 1.25 < IWP £ 1.75 |
| dirty | V | 1.75 < IWP £ 3.00 |
| very dirty | VI | 3.00 < IWP £ 5.00 |
| extremely dirty | VII | IWP > 5.00 |
Based on the information provided by the ChAD expeditions, the IWP calculated value varied from 0.19 to 5.66. Thus, the Kerch Strait waters were characterized by a large spread of IWP values varying from the 1st to the 7th class of water quality in the range from ‘clean’ to ‘extremely dirty’. The case of August 2008 was taken as an example (Fig7.3a).
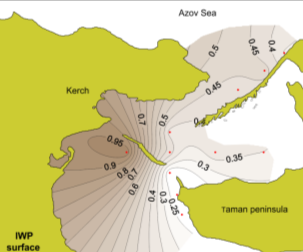
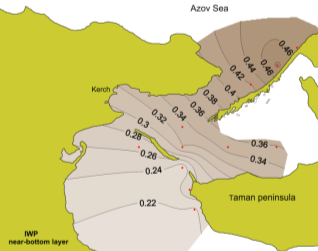
Fig. 7.3a. The IWP distribution at the surface (left) and in the bottom (right) layers on 31 August 2008.
In the period of the summer survey, IWP varied from 0.2 to 0.99 that corresponded to the 1st-3rd classes of water quality. Basically, the IWP average values varied for different expeditions and layers in the range of 0.28-0.73 (Table. 7.3b). Those values corresponded to a clean type of water or its 2nd class (MR, 1988). The bottom layer was cleaner than the surface one. In general, throughout the water column, the more polluted areas were detected in the Western and Northern parts of the Kerch Strait.
Table 7.3.b. The IWP variability statistics based on the ChAD surveys carried out on the Kerch Strait in 2008.
| No of stations | min | max | Average | standard deviation | |
| surface layer, summer, July-August | 11 | 0.20 | 0.99 | 0.40 | 0.21 |
| bottom layer, summer, July-August | 11 | 0.22 | 0.48 | 0.33 | 0.09 |
| surface layer, autumn, November | 31 | 0.19 | 0.46 | 0.28 | 0.07 |
| bottom layer, autumn, November | 31 | 0.19 | 0.64 | 0.29 | 0.12 |
| surface layer, winter, December | 28 | 0.19 | 5.66 | 0.73 | 1.34 |
| bottom layer, winter, December | 28 | 0.19 | 1.53 | 0.38 | 0.29 |
The IWP maximum values corresponding to waters of extremely dirty types were detected in the Southern part of the Kerch Strait during the winter period. Those high IWP values had derived from petroleum hydrocarbons high concentrations present therein.
7.4. Summary: Other pollutants in the Kerch Strait
Prior and especially after the November 2007 heavy storm, frequent investigations were carried out to define pollutants distribution in the Kerch Strait area. The trace metals 1990s historical data have revealed presence in the bottom sediments of numerous geochemical elements with concentrations at the background level. Sometimes elevated cadmium, zinc and iron content was observed. Constant high arsenic values had probably derived from anthropogenic pollution and an increased natural geochemical background. The measurements performed straight after the Kerch Strait accident, i.e., in December 2007 and March 2008 revealed the maximal levels of chromium, cobalt, zinc and nickel in sediments reaching about 0.7-1.6 PC and the much lower average values. A year later in July 2009, in three cases only the copper, chromium and nickel concentrations in sediments were detected slightly above 1 PC, while for the others (Cd, Сo, Hg, Pb, Zn, As and Al) they were substantially lower than the mentioned threshold. At the same time, results were obtained for the Strait waters and all the metals concentrations there tested on 8 July 2009 sustained less than 1 MAC (approximately ten times lower). Some increase of the metals content in the bottom sediments was recorded in December 2009 when maximum concentrations of chromium and nickel had slightly exceeded 1 PC, while those for cadmium, mercury, cobalt, copper, zinc and arsenic were slightly less than the norm. In general, metal content in the Kerch Strait area before and after the accident in November 2007 was at the geochemical background level and was exceeding the norm occasionally only.
Sulphur concentration in the Kerch Strait bottom sediments was detected very high through the whole year after the November 2007 shipwreck accident. Average concentrations during summer, autumn, and winter 2008 were registered as 3.25, 1.3, and 1.67 of PC respectively and their maximum had reached 2.87 mg/g. Nevertheless, no apparent negative impact on the nature was recorded most probably due to the substance low poisoning features.
Chlorinated pesticides in the Kerch Strait waters were detected rather often and were sometimes exceeding the MAC. All forms of the HCH and DDT group were registered including “fresh” lindane and DDT. For instance, in December 2007 the γ-HCH maximum concentration was reaching 2.5 ng/l (0.25 MAC) and that of DDT - 12.2 ng/l (1.2 MAC), (MHI results). A similar level (1.3 ng/l - 4.0 ng/l) was recorded about the same time by another Institution (IBSS). In a couple of months their concentration in the water went down by about 10 times (MHI), which was evidence of a temporal variability of a high level to have probably resulted from arrival to the Kerch Strait of the waters of different origin (e.g., washing of pesticides from agricultural lands after heavy rains, etc.).
In December 2007 and March 2008, the total pesticides concentration in the bottom sediments was registered low and not exceeding 2 ng/g (MHI). An year later by July 2009 their content had increased significantly, especially of DDE that got the 7.5 ng/g maximum, and rather often exceeded the PC (UkrSCES). Such a discrepancy in DDE values could be to some extent explained by the analytical differences existing between the two Ukrainian institutions UkrSCES and MHI providing data.
The data on PCBs presented by different Institutes do not allow to draw conclusions on the level of this kind of pollution in the Kerch Strait. For instance, one source (MHI UNAS) has reported rather low polychlorobyphenyls quantity present in the Kerch Strait bottom sediments. Their total concentration was given as reaching 7.78 ng/g in December 2007 and that level was about three times lower the Permissible Concentration. Some months later (spring 2008) their average content was registered even lower as 3.06 ng/g and the situation has not changed in July 2009. Still, the December 2009 wide investigation results of UkrSCES showed all the tested sites strongly polluted with PCBs at the level reaching up to 20 PC.
Results obtained from the water studies were also with some discrepancies. Thus, in general, according to the investigations described above, a low PCBs content in winter 2007 and spring 2008 was observed in the Kerch Strait by MHI. That level corresponded to “unpolluted water” in line with the World Health Organization classification. Unlike, the investigations carried out by IBSS in December 2007 revealed the PCBs presence in the Kerch Strait surface waters as high as 31.46 ng/l (MAC is 10 ng/l). Contradictions in data provided by different analytical laboratories could appear because of various reasons, of course. Different sampling procedures and methodologies of processing applied could serve as a possible explanation for disparities in the PCBs data. Lack of normalization, absence of parallel granulometric analysis should also be mentioned among the possible sources of discrepancies. Inventories of the applied methodologies and equipment used should be kept in parallel with the reported data. Inter-calibration and inter-comparison exercises should be undertaken in the Black Sea region for both water and sediments to make sure that the levels of PCBs measured reflect the real intensity of this kind of pollution in the studied marine environments.
The complex index of water pollution (IWP) was applied by the former Soviet Union countries as a standard tool for the water quality classification within the studied area. Based on average calculation, the Kerch Strait waters could be assessed as conditionally “clean” or ‘moderately polluted’ during 2007-2009, while the maximal levels observed have revealed certain periods and places heavily polluted by petroleum hydrocarbons.
Chapter 8. Description Of Biological Communities And Their Experienced Impact
Eremeev V., Boltachev A., Agapov S., Mironov O., Burdiyan N., Mukhanov V., Rylkova O., Bryantseva Yu., Zagorodnaya Yu., Alyomov S., Gaevskaya A., Komorin V., Kovalishina S., Klimova T., Karpova E., Fashchuk D., Spiridonov V., Simakova U., Kolyuchkina G., Belyaev N., Shapovalova E., Birkun A., Krivokhizhin S.
8.1. Microorganisms in the water and sediments
8.2. Phytoplankton
8.3. Zooplankton
8.4. Macrozoobenthos
8.5. Phytobenthos
8.6. Ichthyoplankton
8.7. Ichthyofauna (Fishes)
8.8. Parasitology
8.9. Mass mortality of fish due to the low oxygen water presence
8.10. Cetaceans
8.1. Microorganisms in the water and sediments
UA: IBSS. December 2007 and August-September 2009.Water. At 12 stations, abundance of planktonic microorganisms (heterotrophic bacteria, picophytoplankton) and the virus-like particles presence in the Kerch Strait surface waters were investigated in December 2007, i.e., immediately after the oil spill happened, while at 20 stations located in the Kerch Strait and the Black and Azov Seas adjacent waters studies were carried out in August 2009.
In December 2007, the heterotrophic bacteria density was recorded in the range of 2.1-4.4 mln cells.ml-1and it was substantially higher the levels previously registered for the region (e.g., up to 1.4 mln cells.ml-1 in the 1990s summers), and even exceeding the Sevastopol Bay (highly polluted waters) levels, (Chepurnova E.A., 1993, Mukhanov et al., 2003). Abundance of phytoplankton and photoautotrophic picoplankton (9,700-23100 cells.ml-1 equal to the cyanobacterial numbers upper limit for the Western and North-Western Black Sea) remained within their typical levels for the area, therefore high bacteria concentrations observed could have been related to increase in the allochthonous organic matter inflow. The virus-like particles (VLP) plankton abundance (investigations carried out at the Black and Azov Seas for the first time) ranged from 6 × 10⁷ cells.ml-1 to 108 cells.ml-1 that was typical for highly polluted marine coastal waters.
In August 2009, numbers of heterotrophic bacteria were registered as 3.4-14.8 mln cells.ml-1 (average ± 95% CI: 7.6±1.5´ 106 cells.ml-1) and of picophytoplankton - as 3,200-93,900 cells.ml-1 (average: 19.7 ± 10.6 ´ 103 cells.ml-1), while their spatial distribution was recorded uneven. High presence of heterotrophic microorganisms was registered in the Kerch Strait Northern section, while the low presence, mainly detected in the central section, well coincided with the hydrochemical parameters distribution (Chapter 5). Bacteria’s increased abundance in August was well related to the high water temperatures.
Summarizing the results obtained in 2007 and 2009, it must be noted that abundance, composition and spatial distribution of pelagic microbial community in the Kerch Strait reflected the presence of highly polluted waters right after the Kerch accident. However, in 2009 the studied bacteriological parameters were controlled by natural factors such as the Kerch Strait water temperature gradient, the Black and Azov Seas water-mass exchanges, trophic processes, etc., and they were hardly related to the post-disaster effects.
UA: IBSS. December 2007 and March 2008. Bottom sediments. There are 28 classes of bacteria (over 100 species), 30 species of fungi and 12 species of yeasts that are capable of decomposing (oxidizing) petroleum hydrocarbons (PHs), (Ivanov V.P., Sokolsky A.F., 2000). They belong to genus Pseudomonas, Achromobacter, Mycobacterium, Flavobacterium, Corynebacterium, Micrococcus, Bacillus, Vibrio, Actinomyces, Proactinomyces, Streptomyces, etc. The hydrocarbon oxidizing bacteria presence in common microbial and saprophytic populations range from 0.1% to 10% in clean waters and from 35% to 80% in the areas of chronically polluted coastal waters. Respectively during oil spills, the PHs decomposing bacteria abundance could be higher than that of the saprophytic microflora (Tsyban A.V., Simonov A.I., 1979).
After the Kerch Strait accident, the microorganisms sediments abundance was carefully studied on 12-18 December 2007 and in March 2008 (13 stations, the Experiment RV, Fig. 6.2.9a). Total abundance of heterotrophic microorganisms (1,500 to 950,000 cells per gram of wet soil) was two times higher than of the PHs-oxidizing species. However, the latter were discovered present in all the bottom sediment samples, and in March 2008 their density was recorded increased by 1-2 order of magnitude compared to the data obtained in December 2007. Bottom sediments collected from the waterway area and by the coast contained oil-decomposing bacteria present in maximal densities. Besides, numbers of those bacteria present in the conditionally clean water area sediments (for instance, the Black Sea areas located far from the oil pollution sources) were hundred times lower (0.4 cells per gram) than in the Kerch Strait areas.
RU: AzNIIRKH. November-December 2007. Bottom sediments and the water. Right after the Kerch Strait accident, abundance of petroleum oxidizing microorganisms in its waters was changing from 0 cells.ml-1 (in the bottom sediments at certain stations) to up to 106 cells.ml-1. Bacteria’s abundance was at the maximum at the water surface averaging 3x10⁴ cells.ml-1 along the whole Kerch Strait basin. Down from the surface, the abundance kept substantially reducing to reach 50 cells.ml-1-100 cells.ml-1. Abundance of petroleum destructing bacteria was registered at the highest maximum of 105-106 cells.ml-1 in the water surface layer of the Tuzla Spit and at the Taman village traverse of the Taman Bay vicinity. In the Kerch Strait Southern section, as well as in the Chushka Spit vicinity bacteria’s abundance was substantially lower (Fig. 8.1a). Stations located in the Tuzla Spit vicinity (its Northern section) and the Taman Bay central section registered the maximal petroleum oxidizing bacteria abundance (Fig. 8.1b). Their concentration was found substantially lower in the bottom sediments of the Kerch Strait Southern section and in the Chushka Spit vicinity (Korpakova I.G., Agapov S.A., 2008).
In the Azov Sea, the total petroleum decomposing bacteria abundance in water kept changing from 0 cells.ml-1 to 1,000 cells.ml-1 to average 100 cells.ml-1 at the surface, and around 5 cells.ml-1 - at the 5 m depth and near the bottom. The highest petroleum decomposing microorganisms presence (200 cells.ml-1 - 330 cells.ml-1) in the water surface layer was witnessed at the stations located in the Southern, Eastern and South-Eastern Azov Sea sections to include the Temruk Bay (Table 8.1a, Fig. 8.1a). In the bottom sediments their concentration ranged within 10 - 1,000 cells.g-1 averaging 100 cells.g-1. The highest petroleum decomposing bacteria abundance was registered in the Kerch Strait bordering section of the Southern Azov Sea area to sustain 1,000 cells.g-1 (Fig. 8.1 b) in the bottom sediments of majority of stations.
In the Black Sea, the petroleum destructing bacteria water presence was comparable with their Azov Sea abundance though substantially lower than in the Kerch Strait. In the pre-strait area, the presence did not exceed 100 cells.ml-1, while in the bottom sediments it averaged 250 cells.g-1 fluctuating within the range of 100 cells.g-1-1,000 cells.g-1 (Fig. 8.1b). A higher presence of these bacteria was considered typical for the water basin stretching from the Iron Horn Cape till the Blagoveschenskaya village.
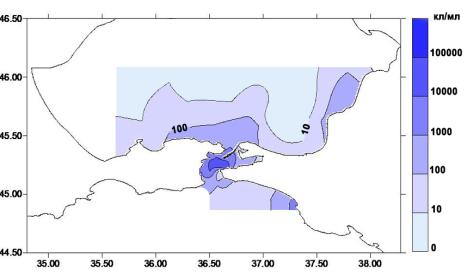 |
Fig. 8.1a. Abundance of petroleum decomposing bacteria in the Kerch Strait water at surface with the Azov and Black Sea adjacent water basins, November-December 2007 (Korpakova I.G., Agapov S.A., 2008).
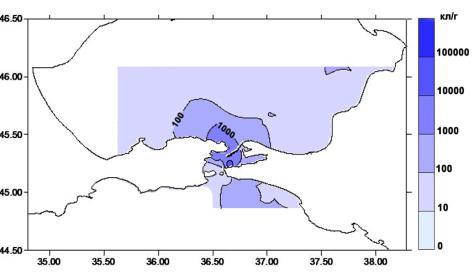 |
Fig.8.1b. Abundance of petroleum decomposing bacteria in the Kerch Strait bottom sediments with the Azov and Black Sea adjacent water basins, November-December 2007 (Korpakova I.G., Agapov S.A., 2008).
Table 8.1a. Abundance of petroleum decomposing bacteria in the water and bottom sediments of investigated areas in November-December 2007 (Korpakova I.G., Agapov S.A., 2008).
| Place of sampling | Horizon | Abundance of petroleum oxidizing bacteria | ||
| water (cells.ml-1) | bottom sediments (cells.g-1) | |||
| Azov Sea | ||||
| Eastern Azov Sea area to include the Temruk Bay | surface | (0–1,000) / 200 | 10–10060 | |
| 5 m | (0–10) / 4 | |||
| near bottom | (0–10) / 3 | |||
| Central Azov Sea area | surface | (0–100) / 20 | 10–10060 | |
| 5 m | (0–10) / 2 | |||
| near bottom | (0–10) / 2 | |||
| Southern Azov Sea section | surface | (100–1,000) / 330 | 100–1,000400 | |
| 5 m | 10 | |||
| near bottom | 10 | |||
| Western sea area | surface | 10 | 10 | |
| Kerch Strait | ||||
| Chushka Spit vicinity (its Southern end) | surface | 1,000 | 1,000 | |
| near bottom | 0 | |||
| Tuzla Spit vicinity | surface | (10,000–1,000,000) / 37,000 | 1,000–10,0004,000 | |
| near bottom | (100–1,000) / 400 | |||
| Northern Tuzla Spit side, the Taman Bay area till the Taman village | surface | (10–100,000) / 66,700 | 100–100,00034,000 | |
| near bottom | (10–100) / 40 | |||
| Southern Kerch Strait section | surface | (1,000–10,000) / 6,400 | 10–1,000300 | |
| 5 m | (10–100) / 70 | |||
| near bottom | (0–100) / 30 | |||
| Black Sea | ||||
| pre-Strait area | surface | 100 | 100 | |
| 10 m | (0–10) / 5 | |||
| near bottom | (0–10) / 5 | |||
| Open-sea area (sea stations) | surface | (10–100) / 30 | 100–1,000 330 | |
| 10 m | (0–10) / 3 | |||
| 20 m | 0 | |||
| near bottom | 0 | |||
| Abrau village vicinity | surface | 1,000 | 100 | |
| 10 m | 1,000 | |||
| 20 m | 10 | |||
| near bottom | 0 | |||
Therefore, bacteria density was detected on decline down from the surface to the bottom in all water basins under investigation. Out of all water depths under research, bacteria’s maximal abundance was registered in the Tuzla Spit vicinity in the Kerch Strait, i.e., in the Taman Bay central part. There, as well, abundance of petroleum decomposing bacteria in the bottom sediments was recorded the maximal for the whole region under investigation.
A relatively high abundance of petroleum decomposing bacteria recorded at certain Kerch Strait stations (at the 104 - 106 cells.g-1 levels) evidenced the ongoing microbiological processes of petroleum-origin organic substances transformation in the water surface layer. Still in general and due to low temperatures, the total petroleum decomposing bacteria presence kept remaining relatively low in the water of all investigated sections right after the Kerch accident.
UA: IBSS. October-December 2007 and August 2009. Prior to and after the Kerch Strait accident, the main parameters of phytoplankton were registered as follows:
| density (mln.cells·m-3) | biomass (mg·m-3) | number of species | dominating group | |
| October 2007 | 47.27-244.59 | 315.85 – 1,797 | 46 | Diatoms (26 species) |
| December 2007 | 65.6 – 8,684 | 83.23 – 2,240.22 | 39 | Diatoms (16 species) |
| August 2009 | 96 - 638 | 162.21 – 9,887.55 | 50 | Diatoms (26 species) |
In October 2007, diatoms predominated at all stations. Their presence in the total abundance and biomass was exceeding 96% (mainly elongated large diatoms). Cyanobacteria were second in abundance (8.9%) with domination of Lingbya limnetica. Dinoflagellates accounted for 2.89% and were second by presence in biomass.
By December, the dinoflagellates presence was registered increased in total biomass while that of Diatoms, Cyanophyceae and Chrysophyceae had slightly decreased, and Cyanophyceae had significantly raised their contribution to abundance. Among cyanobacteria, the representatives of genus Oscillatoria were dominant both in abundance and biomass. Their total abundance ranged from 29% to 93% followed by that of diatoms (centric forms such as Coscinodiscus, Skeletonema costatum) and flagellates. Large diatoms dominated in biomass over the entire area (from 67% to 99%).
In August 2009, Bacillariophycea species were mainly recorded represented by Pseudosolenia calcar-avis and Proboscia alata, and 12 species of dinoflagellates and six of cyanobacteria were present as well. Out of dinoflagellates, the maximal abundance was registered of Prorocentrum micans (316.6 mln.cells m-3). Near the Tuzla Spit, those species biomass was determined critically high evidencing a poor water quality.
Comparison between the phytoplankton community condition status prior to and after the Kerch Strait accident has revealed insignificant differences. Variability of the algal abundance and biomass or the species composition would be rather attributed to high level of eutrophication present in the strait than to the oil pollution.
UA: IBSS. December 2007 and August-September 2009. Mesozooplankton samples (ten samples in winter and 30 in summer) were collected by means of vertical hauls of the Juday net with the mouth diameter of 36 cm and 140 μ mesh size.
In December 2007, right after the accident, groups dominant in the mesozooplankton community were Cirripedia larvae (49%) and copepods (41% of total abundance), (Zagorodnyaya Yu.A., 2009), which was traditional for the area. Presence of dead plankton organisms was high reaching 11.7% in average and varying from 2% to 34%, while their maximal numbers were detected not far from the oil spill site that might have contributed to the zooplankton mortality increase. However, rapid changes in water temperature and salinity, to follow the storm that occurred during the accident and after, could have also become a factor to cause increase in mortality.
In August 2009, the highest by abundance groups were recorded cladocerans (37%) and copepods (32%) followed by the pelagic larvae of benthic invertebrates (27%). Among the copepods, two species of Acartia genus - Acartia clausi and Acartia tonsa - were dominant accounting for 86% of total abundance, and were followed by other species typical for the Black Sea, i.e., Centropages ponticus (13%). Acartia genus is known for being very tolerant to changes in environment conditions (like salinity and temperature), and in the Kerch Strait shallow coastal waters those organisms play an important role in the community structure. Among the cladocerans, Pleopis polyphemoides were often found present. From the plankton other groups, three species of Ctenophora, chaetognathes and larvae of benthic animals were observed.
In September 2009, the structure of the mesozooplankton community was not recognized as significantly changed in the Kerch Strait. Abundance of the Paracalanus parvus copepod was recorded slightly increased, while that of Acartia - decreased. Both total abundance and biomass were registered at the slightly lower levels than the long-term annual averages.
In 2009, the dead plankton individuals presence was detected significantly lower, as compared to December 2007, and it varied between 1% to 7% evidencing a better condition status of the mesozooplankton community. No residual influence of the Kerch Strait accident was detected.
UA: IBSS. December 2007, March 2008 and August 2009. In the course of observations conducted on 12-18 December, when onboard of the Experiment RV, 24 stations were surveyed in the Kerch Strait Ukrainian section from the Azov to the Black Sea, 55 species were detected to include 24 shellfish species, 7 crustaceans, 15 polychaetes worms, and other taxonomic groups representatives, i.e., nemertean, oligochaetes, ascidians, flatworms, etc. The correlation of different taxonomic groups present, in particular predominance of molluscs and polychaetes worms, might be considered as typical/classical for the Crimean coastal waters. The species number per station varied from 5 to 26. At the same time, presence of seven species (Hydrobia acuta, Mytilaster lineatus, Heteromastus filiformis, Nephtys hombergii, Nephtys cirrisa longicornis, Anadara inequivalvis, Bittium reticulatum) and Olygochaeta was registered exceeding 50%, while 26 species were detected at one-two stations only. The richest species variety was discovered eastwards from the Tuzla Island and the poorest - at the entrance to the Azov Sea, i.e., in the areas impacted by the November 2007 oil spill. In the area under observation, three major habitats with a 30% similarity between them were identified through the Bray-Curtis cluster analysis (Fig. 8.4a). Habitat A (the dominant species were Mytilaster lineatus) covered the area at the Kerch Strait exit to the Azov Sea. Habitat B (the dominant species was Chamelea gallina) covered the area at the exit to the Black Sea. Habitat C with two Sub-habitats C1 and C2 covered the Kerch Strait total area. Hydrobia acuta (small gastropod) was typical for that habitat. Species composition of the Sub-habitat C2 was most diverse that had been possibly predetermined by the near-bottom layers salinity change.

Fig. 8.4a. The Cluster and MDS (Multidimensional Scaling) analysis of benthic communities similarities detected at the Kerch Strait stations in December 2007.
In December 2007, macrozoobenthos abundance and biomass varied significantly from station to station, especially in the Kerch Strait central section. The maximal biomasses were within the range of 432.4-535.6 g/m2 due to the presence of mature Anadara inequivalvis, the Mytilaster lineatus individuals and young Rapana venosa. At the same time, the macrozoobenthos biomass did not exceed 10 g/m2 at half of the stations. Abundance varied from 300 to 132,037 individuals per square meter. High density of small Hydrobia acuta gastropod (1,900-21,370 ind/m2) and young Mytilaster lineatus (440-127,825 ind/m2) was detected at the Kerch Strait exit to the Azov Sea.
In March 2008, 27 stations were observed and 46 species were detected to include 20 mollusc species, 10 crustaceans and 12 polychaete worms. Compared to December 2007, frequency of occurrence of Nephtys longicornis, Anadara inequivalvis, Bittium reticulatum decreased by up to 10-30%. However, the Melinna palmata frequency of occurrence exceeded 50%. All along the Kerch Strait, diversity indicators for March 2008 were recorded lower than for December 2007, while - at the same time - distribution of major species remained without a serious change. However, macrozoobenthos abundance and biomass had decreased significantly at the entrance to the Azov Sea, as compared to December, mainly due to Anadara inequivalvis, Hydrobia acuta and Mytilaster lineatus decrease in abundance and biomass. Also, Microdeutopus gryllotalpa discovered in December at half of the stations was not detected in March 2008.
In 2007–2008, molluscs predominated in macrozoobenthos abundance and biomass at most of the stations observed. According to the feeding type, mostly present were the detritophagues.
Through controlling the area further on, macrozoobenthos was studied at 20 stations in August 2009. General variability of qualitative and quantitative parameters, including the groups systematic presence, hardly differed substantially from the levels observed in 2007-2008. In total, 46 species were detected, including 20 mollusc species, 9 crustaceans, 11 polychaete worms as well as other taxonomic groups representatives, i.e., Nemertina, Oligochaeta, ascidians, flatworms, etc. The number of species detected per station varied from 3 to 14. At one station, 22 species were recorded. The richest biodiversity was observed in the Kerch Strait central section. Only three species (Hydrobia acuta, Mytilaster lineatus and Nephtys hombergii) had higher than 50% occurrence, while seven other had it at 25%.
Unlike of 2007-2008 winter and spring periods, in summer 2009 two major habitats with 30% similarity were determined through the Bray-Curtis cluster analysis. Habitat A, where Mytilaster lineatus and Hydrobia acuta were the dominant species, covered the area close to the Azov Sea strait entrance jointly with the Kerch Strait Northern section. Habitat B, with the Chamelea gallina and Melinna palmata dominant species, covered the area at the Black Sea strait entrance jointly with the Kerch Strait Southern section up to the Tuzla Island.
Macrozoobenthos abundance and biomass varied significantly in August 2009, as it had been previously observed as well. Low abundance and biomass were recorded in the Black Sea adjacent strait area. Biomass of up to 100 g/m2 was detected in the Kerch Strait central section due to Ch. gallina, Anadara inequivalvis and young Rapana venosa presence. Ch. gallina belongs to the oil-sensitive group of species. Therefore, increase in its abundance and biomass could be taken for an indicator of low oil content presence in the bottom sediments in that part of the strait. The macrobenthos maximal biomass reaching up to 1,000 g/m2 was observed at the Azov Sea strait exit. Abundance varied from 300 to 60,000 individuals per square meter being the highest in the Kerch Strait Northern section. High densities of small Hydrobia acuta gastropods (up to 30,000 individuals per square meter) and young Mytilaster lineatus (up to 40,000 individuals per square meter) were detected at the Azov Sea strait exit. In general, macrozoobenthos abundance and biomass were increasing from the Black Sea towards the Azov Sea, while the species diversity was decreasing.
The 2007-2009, the macrozoobenthos studies results have confirmed that the Kerch Strait macrozoobenthic community structure was typical for the areas once stressed by anthropogenic activities, however, no significant evidence of experienced impact of the Kerch Strait accident was found. Quantitative and qualitative parameters of the bottom communities detected at the depths from 5 m to 20 m and recorded in the period from December 2007 (shortly after the accident) till August 2009, appeared to be similar to those registered before the accident. As is well known, the Kerch Strait oil spill largely went onto the shore. Reports were circulated about increased crustacean mortality and that numerous dead shellfish and seawalls were found ashore (Matishov G.G., 2008). However, both phenomena could have been equally produced by the high waves instead of resulting from oil contamination.
No doubt, any pollution deterioration of the Kerch Strait bottom sediments could further negatively impact the bottom communities condition status, as well as the Kerch Strait ecosystem self-purification capacity, since the filter-feeding species abundance has gone down and the general diversity presence currently stands low, while the habitats are quite unstable. The mentioned conclusion has been well supported by several studies conducted in the Kerch Strait in 2008-2009 and to be presented further on.
RU: Institute of Geography. August 2008: The Ukrainian coastal waters bottom sediments condition status. On 13-15 August 2008, the Russian Academy of Sciences Institute of Geography, IG RAS organized the Kerch Strait visual diving survey and collected some bottom sediments samples in order to properly assess pollution levels. The stations location scheme (Fig. 8.4c) was built in line with results of the Kerch Strait oil spill expansion mathematical modeling simulated for a six-day period of 11-16 November 2007 (Ovsienko S.N. et al,. 2008) and results of the Kerch Strait aerial survey (Fig. 8.4d) conducted at the same time (Matishov G.G., 2008). The idea behind was to check whether the oil was still present in the areas identified as impacted and where, if at all, it could have settled down.
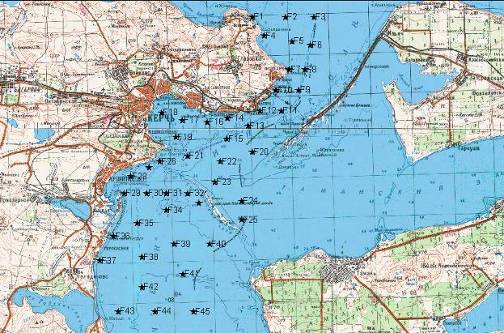
Fig. 8.4c. Scheme of the bottom sediments visual diving survey and sample collecting conducted in the Kerch Strait on 13-25 August 2008.
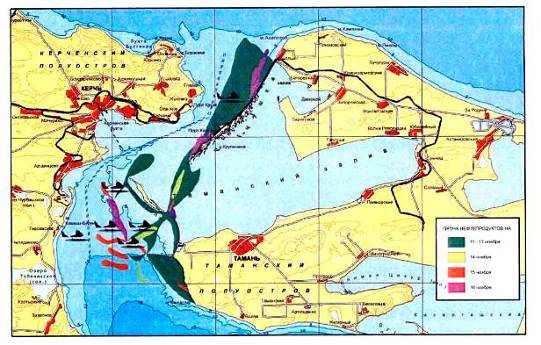
Fig. 8.4d. Scheme of oil expansion resulting from the 11 November 2007 oil spill accident in line with results of the Kerch Strait aerial survey conducted on 11-16 November 2007 (Matishov G.G., 2008). Periods: in green – 11-13 November, in yellow – 14 November, in red – 15 November and in pink – 16 November.
Distance between the stations varied from 1 km to 2 km. To carry out the bottom visual survey, 41 scuba-divings were performed. No oil spots were discovered anywhere, even at the Tuzla Island and the Taman Bay entrance.
Satisfactory was found condition status of the Rapana venosa population inhabiting the areas in vicinity of the Tuzla Island Eastern coast. This evidenced that benthic communities, investigated at the Kerch Strait impacted locations, had not been badly damaged as a result of the accident.
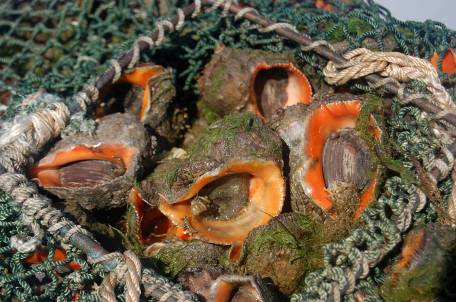
Photo. Intact Rapana venosa collected from the bottom by the Tuzla Island Southern and Eastern coasts in August 2008.
Rapana venosa. Since 1995, the AzNIIRKH scientists have been engaged with monitoring research into the status assessment of mollusc populations inhabiting the North-Eastern Black Sea. According to the multiannual data, the Kerch Strait fishing area has always had a high Rapana population bioproductivity. The area is populated by different age groups of Rapana to include the 9+ and 10+ species. According to averaged multiannual data, the share of commercial size species (70 mm) exceeds 40% of population, while its distribution density averages 2-3 ind/m2. Taking into consideration Rapana’s bottom-based way of living, it was expected that settling down of huge volumes of fuel-oil and sulphur left from the November 2007 accidents would negatively affect this gastropod population and stock. To determine the accidents impact on the Rapana communities condition status, in August-September 2008 relevant data were collected in the Kerch Strait and Black Sea coastal zone (Russian coastline). Sampling was carried out at 100 submerged stations located at the depth from 1 to 20-25 meters. The expedition thoroughly inspected the Tuzla and Chushka Spits costal zones since Rapana population there had increased in numbers in 2006-2007 and huge volumes of fuel-oil were washed ashore in November 2007 in the vicinity of those spits in particular.
Based on the data collected, in 2008 certain changes in molluscs distribution density, as well as in its size-and-mass and age structure were determined within the limits of potential long-term fluctuations though. Thus, Rapana was found present along the whole Russian Black Sea coastline from Adler to the Panagia Cape, as well as in the Kerch Strait waters at the depth from 2.5 m to 20 m. The Rapana distribution density broadly varied depending upon the area of investigation and it most often sustained 0.01-0.5 ind/m2. In 2008, Rapana’s high abundance concentrations (exceeding 15 ind/m2) were detected less often than during the previous years of investigation.
In the course of a more detailed analysis of Rapana venosa community presence in the Kerch Strait it was revealed that by the inner side of the Tuzla Spit young individuals could spread with density of 0.1-0.5 ind/m2 at the depth of 0.5-5 m, while by its outer side and outwards of the Chushka Spit - at the depth of 20 m. Concentrations of 20-30 ind/m2 density were detected at the middle-belts sites where the species mass and abundance were reaching their highest levels. Still, in 2008 no Rapanas were found in the Taman Bay proper.
Assessment of the Rapana population structure failed to reveal any substantial changes both in the species age and its gender composition. Still, it is worth noting that the share of the elder-group and larger-size (exceeding 10 cm) species had gone down, though unsubstantially in comparison with previous investigations. The 2008 analysis of this gastropod physiological and biochemical condition status did not reveal either any substantial change in its population.
Thus, analysis of materials collected showed that the Rapana population distribution, abundance and structure in the Kerch Strait area had not been negatively impacted by the Kerch accident substantially, or the effect of the pollutants discharged into the strait waters in November 2007 was hardly distinguishable from the existing chronicle pollution influence and changes predetermined by the unstable environment conditions naturally present in the Strait.
Pontogammarus. Pontogammarus is the sole relict crustacean species present all along the Azov Sea coastline. It proves to be a reliable indicator of the water basin ecosystem wellbeing. While a typical filter-feeder, in coastal habitats pontogammarus has a vital role to play in the substance and energy transformation processes. Its intense development seriously affects the coastal zone self-purification ability which is anthropogenic impact prone. Due to this, the pontogammarus population condition status served as reliable indicator in the assessments of the aftereffects of the November 2007 accident.
Assessment of the pontogammarus population distribution, concentration density and stock evaluation was carried out in June-July 2008 by means of a 100 сm2 measuring frame at the Azov Sea coastal zone standard stations located close to the accident area, i.e., the Chushka Spit, Ahilleon Cape, Ilyich village, Za Rodinu village and at the Golubitskaya station. Additional materials required for the population more reliable characteristics identification were collected through a dip net at the same sites. The stock size was calculated based on measuring the small crustacean distribution density per 1 m2 area and the coastline length including its curves (Korpakova I.G., Agapov S.A., 2008).
According to accumulated data, no substantial change in the pontogammarus population qualitative and quantitative condition status was revealed. Thus, in the Ilyich village and Chushka Spit coastal zone, the worst oil pollution affected area, population density and biomass, juveniles share and eggs number per female species were recorded the highest for the last three years of investigations, while still revealing a slight decrease (less than 11%) of female species abundance in selection (Table 8.4a).
Table 8.4a. Characteristics of pontogammarus population present in the Kerch Strait area with the Azov Sea adjacent section in 2005-2008 (Korpakova I.G., Agapov S.A., 2008).
| Year | Species/m2 | Biomass,g/m2 | Juveniles,% | Females,% | Females with eggs, % | Number of eggs per one female |
| Golubitskaya station | ||||||
| 2005 | 15,421 | 391.0 | 25.8 | 61.3 | 8.0 | 5 |
| 2006 | 11,712 | 250.4 | 7.5 | 59.7 | 2.0 | 9 |
| 2007 | 53,373 | 353.3 | 79.9 | 17.0 | 17.0 | 12 |
| Averaged 2005–2007 | 26,835 | 331.6 | 37.3 | 46.0 | 9.0 | 9 |
| 2008 | 54,906 | 483.4 | 73.5 | 49.4 | 4.9 | 13 |
| Za Rodinu village | ||||||
| 2005 | 18,466 | 328.7 | 40.8 | 55.8 | 7.0 | 7 |
| 2006 | 27,200 | 607.6 | 2.2 | 54.1 | – | – |
| 2007 | 45,350 | 254.7 | 74.0 | 6.0 | 6.0 | 12 |
| Averaged 2005–2007 | 30,339 | 397.0 | 39.0 | 38.6 | 4.0 | 6 |
| 2008 | 21,700 | 199.5 | 63.5 | 36.3 | 5.0 | 7 |
| Ahilleon Cape | ||||||
| 2005 | 650 | 14.6 | 15.4 | 45.5 | – | – |
| 2007 | 7,200 | 75.3 | 48.6 | 5.4 | 5.4 | 10 |
| Averaged 2005–2007 | 3,925 | 44.9 | 32.0 | 25.4 | 3.0 | 5 |
| 2008 | 1,700 | 22.0 | 41.2 | 50.0 | 10.0 | 11 |
| Ilyich village | ||||||
| 2005 | 600 | 18.1 | – | 61.7 | 13.0 | 3 |
| 2006 | 1,700 | 46.3 | 4.4 | 81.0 | – | – |
| 2007 | 25,650 | 33.4 | 96.6 | 20.0 | 20.0 | 12 |
| Averaged 2005–2007 | 9,317 | 32.6 | 33.7 | 54.2 | 11.0 | 5 |
| 2008 | 29,900 | 296.7 | 53.5 | 48.2 | 6.1 | 10 |
Pontogammarus communities revealed similar distribution patterns at all investigated sandy bottoms (e.g. nearby the Golubitskaya station). Yet, by the Za Rodinu village and the Ahilleon Cape, lower Pontogammarus population density and biomass were registered, while juveniles share and average eggs number per female individual were exceeding their annual averages. Still, the range of changes remained within the annual fluctuation limits for ecologically relatively safe years. It is worth mentioning that in the process of visual inspection of sampling sites and the adjacent coastline no residue left from the oil-spill pollution was detected.
Assessment of Pontogammarus stock in the areas of investigation are presented in Table 8.4b.
Table 8.4b. The pontogammarus averaged stock (tons) at the sampling stations investigated in 2005-2008 (Korpakova I.G., Agapov S.A., 2008).
| Station | 2005 | 2006 | 2007 | 2005-2007 average | 2008 |
| Ahilleon Cape | 2.4 | – | 12.5 | 5.0 | 3.7 |
| Za Rodinu village | 51.1 | 94.4 | 39.6 | 62.0 | 31.0 |
| Ilyich village | 0.8 | 2.0 | 1.5 | 1.4 | 13.2 |
| Golubitskaya station | 52.1 | 33.3 | 47.1 | 44.2 | 64.4 |
Therefore, the pontogammarus population condition analysis carried out in the area directly affected by the autumn 2007 oil pollution has failed to reveal any substantial change in the population structure and abundance. Minor fluctuations in this Amphipoda numbers kept remaining within their limits of multi-year changes typical for the mentioned species. Analysis of the materials provided gives grounds to assess the consequences of the 11 November 2007 shipwreck as of low impact for the Amphipoda reproduction and stock conditions in the Russian section of the Kerch Strait and Azov Sea coastal zone.
UA: MKARTS-UkrSCES, 2009. In 2009, the Kerch branch of the Marine Coordination Rescue Center of the Ukrainian State Specialized Rescue Services on Water Bodies jointly with UkrSCES (MKARTS-UkrSCES) conducted a survey through diving inspections of the Kerch Strait and the Black and Azov Seas adjacent waters (Fig. 5.2.5.2b). The area surveyed totaled 35,613 m2, while the main results accomplished were the bottom surfaces miscellaneous photo/video materials obtained jointly with the benthic flora and fauna samples analyses carried out to test biota contamination with oil. No oil pollution present was identified at the investigated bottom areas in the course of conducted visual observation.
The individuals alive and eggs of Rapana venosa, Nassarius reticulate, the Diogenes pugilator hermit crab, crab-helmets traces, polychaeta holes, the tube houses most probably belonging to Ampelisca diadema, fragments of the Xantho paressa eelgrass and Pilumnus hirtellus crabs, and empty leafs of Anadara – all that was observed at silt-sand bottoms in the Ukrainian coastal waters at the Kerch Strait entrance to the Black Sea. Silt sand covered with shells of mollusc and polychaeta holes, and the spread around dwellings of mobile hermit crabs were found at the Volgoneft-139 tanker shipwreck site. At the ferry location in the Kerch Strait Northern section between the Crimean and Caucasian harbors, silt soil was detected covered with numerous empty shells partially greened by cyanobacteria. The Actinia equina, balanus, and many Rapana venosa specimens were found (Photo below). Large living molluscs (Mia, Anadara) were not observed alive, though their shells were found present. At several stations located at the exit to the Azov Sea, Nereid and small crabs were discovered.
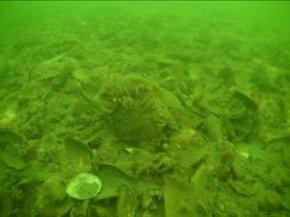

Photo: The Kerch Strait Northern narrowness bottom in 2009.
In 2009, detected presence of crabs, hermit-crabs and mole-crabs, that used to be numerous in 1960s and almost disappeared later, evidenced the benthic fauna certain recovery in comparison with its condition status in the 1980s. However, an elevated level of organics present in the water revealed an unstable trend toward the Kerch Strait area ecosystem improvement as a whole.
To know, what type of phytobenthos is present in marine environment is crucially important for studying the oil hydrocarbons heavy fraction settling down. Products of seaweeds or macroalgae destruction contribute to hydrocarbons accumulation in the bottom sediments or on the coast.
According to the multi-year data, within the biocenoses of the researched area (the Kerch Strait, Tuzla and Chushka Spits, and the Taman and Dinsky Bays), all communities reside at the depth of up to 4.5 m (in the bays) and up to 20 m (by the spits) and have both poly- and mono-dominating composition, while the composition of assistant species varies. Communities have mosaic formation resulting primarily from difference in soils and due to the curved bottom surface in the places of the riffs coming out to the surface.
Marine grass. At sand and slimy soils in the Kerch Strait, Zostera marina seagrass (eelgrass) presents the communities’ base by forming bushes with relatively high biomass. Assistant species may be fennel-leaved pondweed, Lophosiphonia (Rhodophyta), hornweed and water milfoil. Fragmentations of the multiannual brown seagrass Cystoseira (Phaeophyceae) grow in the places of the riffs coming out to the surface (the Panagia Riff, the Verblud Cape). Annually, the higher plants biomass reaches values in the range of 0.5-5.0 kg/m2 excluding the root mass (Korpakova I.G., Agapov S.A., 2008).
During the period of 23 July-14 August 2008, in the Kerch Strait works were carried out through assistance of several Russian agencies personnel and facilities to lift and transport to the Port Caucasus the Volgoneft-139 tanker’s sunken bow part. As is well known, the Kerch Strait bottom there is densely covered with Zostera marina grass (eelgrass). Young zostera is dominant in communities residing at the depth from 0.3 m to 0.8-1.2 m. At the depth starting from 0.5 m it forms mixed associations and its share in the benthic flora total biomass is around 40%, while down from 1.5-1.8 m it accounts for 90%. Zostera’s dead leaves usually form small floating ‘islands’ on the water surface. While towed after recovery, the Volgoneft-139 bow part apparently released into the water the heavy fuel oil leftovers. This oil, having stuck to the dead floating plants around, was in a while transported to the Kerch Strait Southern section by the water currents and stranded further on onto the Kerch Peninsula coast nearby the Zavetnoe village. The same days, 150 bags of sea grass polluted with small oil particles were collected there (Fashchuk D.Ya., 2009).
The Taman Bay is the only place at the Russian Black Sea coast where the Zostera marina eelgrass forms a wide meadow to make a highly important structural component of the bay ecosystem, while being the organic matter major producer. The Taman and Dinsky Bays main ecosystem types (Fig. 2b) in terms of macrophytes distribution were described by Simakova U.V. (Belyaev N.A., et al., 2009), (Fig. 8.5a) according to results of two SIO RAS expeditions carried out in February-March 2008 and July 2008.
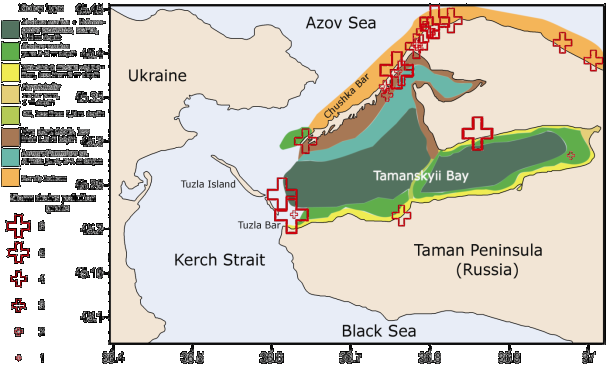
Fig. 8.5a. The bottom ecosystem scheme and the spring visual observation scheme of the storm drains pollution (graded, marked by crosses).
In 2008, eelgrass was also detected in the Kerch Strait waves-protected silt areas jointly with living there different types of macroalgae, mollusc, crustaceans and fish. No pressure on plant formation and reductions in the higher-water-plants biomass as compared with the average multi-year data were registered in 2008.
Signs of a disease known as the “wasting disease” were detected at the Taman Bay during the February 2008 expedition. This disease is caused by the Labyrinthula zosterae, Porter and Muehlstein saprotrophic myxomycete. Normally, this myxomycete is present in old leaves and activates at the initial stages of the plants dying parts decomposition (Den Hartog, 1996). However, destruction of young leaves up to their full disappearance could take place also, when the eelgrass physiological state is deteriorated. Signs of the mentioned disease found in the sea grass would imply that under a stronger pollution effect the disease could spread as well to potentially result in the Kerch Strait “meadows” full disappearance. However, no considerable increase in percentage of the eelgrass leaves infected by Labyrinthula was detected during the summer survey. Vice versa, it is worth noting that in 2008, as compared with previous investigations, the eelgrass development area slightly expanded to the sandy and slow-flow sections of the shallow shelf waters. Thus, along the Tuzla Spit filled section at the Taman Bay side and by the Verblud Cape sandy shelf areas intensely overrun by zostera were detected. The newly emerged formation had a biomass ranging from 0.5 to 2.5 kg/m2, while from the Kerch Strait side it varied between 0.01 and 0.3 kg/m2.
Macroalagae. Not much macroalgae (two families) is usually found in the Kerch Strait, since its loose bottom sediments provide poor conditions for algae development. Macroalgae proliferate in the Kerch Strait shallow coastal waters mainly (more stable bottoms). The Ectocarpus and Cladophora opportunistic filamentous macrophytes, that grow well in polluted environments, are present.
In August 2008, macrophyte biomass varied from 0.35 to 4.7 кg/m2, while reaching from 0.8 to 6.5 kg/m2 at certain sections. According to the data received, macrophytes spatial distribution in 2008 experienced no substantial changes as compared with the previous years of investigation (Korpakova I.G., Agapov S.A., 2008).
Fish reproduction is a sensitive and informative indicator of the water environment condition status. Many fish species avoid polluted areas, while their breeding stock escapes from the polluted water basins for spawning season. Besides, during the embryo and larvae development period the species do not have yet the homeostasis fully-developed system usually acquired at imaginal stages and may be vulnerable to harmful impacts of polluted environment.
UA: IBSS. November-December 2007.
Studies on ichthyoplankton were conducted at eight Kerch Strait stations on 28-29 November 2007 and at ten stations - on 16 December 2007. An inverted Bogorov-Rass net with the mouth opening of 0.5 m2 and mesh size of 500 micron was used to collect ichthyoplankton applying the total vertical (from the bottom to the surface) and horizontal surface catches regime.
The first ichthyoplankton survey was carried out 16 days after the Kerch Strait oil spill occurred. Eggs of sprat (Sprattus sprattus phalericus - 74%) and shore rockling (Gaidropsarus mediterraneus), and sprat and sand lance larvae (Gymnammodytes cicerellus) were found present in the water column. However, despite of the favorable temperature conditions, ichthyoplankton abundance was low. No eggs and only two larvae were found in the horizontal surface catches. In vertical catches, the eggs average number was 6.6 ind/m2, larvae – 0.3 ind/m2. More than 75% of sampled pelagic eggs appeared dead. All dead eggs were detected to have developed abnormalities (bubble formation, compression and deformation of the yolk, lack of pigment in embryos at the later development stages, etc.). High proportion of dead eggs with abnormalities at the last stages of development as well as low numbers of recorded larvae evidenced the presence of unfavorable for their survival conditions two weeks after the oil spill.
Ten vertical and two horizontal surface catches were carried out in the Kerch Strait on 16 December. The sea water temperature was optimal for spawning of the winter-spawning fish species. However, neither eggs, nor larvae were found in ichthyoplankton samples. Therefore, no spawning had occurred.
RU: AzNIIRKH. 2008.
AzNIIRKH research on condition status of ichthyoplankton was carried out in November 2007 and in 2008 in order to assess the Kerch Strait accident afteraffects and the adjacent water areas levels of pollution by oil products and sulphur (Korpakova I.G., Agapov S.A., 2008).
Traditionally, in the Kerch Strait proper ichthyoplankton abundance remains the lowest in comparison with the Black and Azov Seas due to constant changes in current direction resulting in vital parameters modifications of abiotic factors, i.e., water temperature and salinity. In 2008, a broader variety of fish species was witnessed in the pre-strait area from the Black Sea side, while from the Azov Sea side a lesser variety of fish species at the early development stages was recorded (Tab. 8.6a).
Table 8.6а. Average numbers of fish (ind/net) at the early development stages in the Black Sea Kerch-Taman area (Korpakova I.G., Agapov S.A., 2008).
| Species | 2005 | 2006 | 2007 | 2008 | ||||
| eggs | larvae | eggs | larvae | eggs | larvae | eggs | larvae | |
| Sprat | 0.1 | |||||||
| Whiting | 1.1 | 0.3 | 0.3 | 0.1 | 1.0 | 2.1 | ||
| Dogfish | 0.6 | 0.02 | 0.01 | |||||
| Kalkan sole | 0.7 | 0.7 | 5.0 | 0.7 | ||||
| Anchovy | 622.8 | 4.6 | 392.1 | 4.3 | 427.2 | 2.3 | 180.2 | 0.2 |
| Flathead mullet | 0.01 | 0.02 | 0,1 | |||||
| Golden mullet | 0.01 | 0.1 | ||||||
| So-iuy mullet | 0.3 | 0.3 | 0.3 | 0.3 | ||||
| Mullet | 63.4 | 49.0 | 2.2 | 22 | 56.0 | 0.5 | ||
| Horse mackerel | 52.7 | 0.8 | 51.9 | 3.8 | 4.6 | 0.7 | 6.7 | 0.1 |
| Brown meagre | 3.2 | 0.02 | 0.5 | 0.3 | ||||
| Comber | 0.1 | |||||||
| Wrasse | 0.4 | 0.04 | ||||||
| Goldsinny-wrasse | 0.2 | 1.4 | 0.1 | 1.1 | ||||
| Sea bream | 29.4 | 0.02 | 19.6 | 12.9 | 2.9 | 7.6 | ||
| Pegusa nasuta | 0.04 | |||||||
| Ophidion rochei | 0.2 | |||||||
| Scorpaena porcus | 0.2 | 0.4 | 0.2 | |||||
| Stargazer | 1.7 | 0.1 | ||||||
| Dragonet | 0.1 | |||||||
| Blenny | 5.2 | 18.5 | 4.3 | 6.0 | ||||
| Pipefish | 0.01 | 0,1 | 0.04 | |||||
| Caucasian goby | 0.1 | 0.04 | 0.03 | |||||
| Black goby | 0.02 | 0.3 | ||||||
In general, complex research into the ichthyoplankton condition status assessment carried out by AzNIIRKH during the 2008 summer period, as well as comparison of data received with the data obtained in 2005-2007 prior to the oil-spill disaster has made it possible to conclude that the 2007 Kerch accident - after the complex activities were carried out to clean the strait coastline and collect residual oil products – as a whole, produced no substantial impact on fish reproduction in the Azov and Black Sea areas adjacent to the catastrophe site.
UA: IBSS. The 2006-2009 monitoring. November-December 2007.
The Black and Azov Seas waters adjacent to the Kerch Strait are shallow and have no permanent currents; still their circulation is affected by the winds and temperature/salinity gradients. In the narrow-spaced Kerch Strait with adjacent waters, migratory fish form large clusters thus creating favorable conditions for the fisheries. Anchovy and herring, whose migratory routes go through the Kerch Strait, are heavily fished, as well as the gobies, goatfishes, mullets, flounders, sturgeons, rays, sprats, sand smelts, hornhechts and some others. The Kerch Strait adjacent waters are one of the main commercial areas of the Black Sea. Also, it is a major spawning area for different fish species. Within the period of 1986–2007, fish eggs and larvae belonging to 29 species from 22 families were registered in the shelf area between the Kerch Strait and Feodosiya in the Crimea.
In the period of 26 November-2 December 2007, the Kerch Strait ichthyofauna studies were carried out through using the pound and gill nets. For comparison, was used the 2006-2010 monitoring data collected at the Azov Sea along the Kerch Peninsula coast to include the Cazantip Cape (Cazantip Nature Reserve) and the Cazantip and Arabatskaya Bays.
Traditionally, the Azov Sea ichthyofauna has the lowest species diversity compared to the other Mediterranean basin seas. According to different sources, 114-150 species and subspecies of fish are present in the Azov Sea. The genesis, taxonomy and ecological structure of the ichthiofauna there are most heterogeneous due to the rather harsh environment conditions and the sea turbulent geological history. The Azov Sea used to be one of the world most productive regions just 50 years ago and an annual fish catch there used to range from 73 to 82 kg/ha.
In the Cazantip and Arabatskaya Bays, the list of fish species present consists of 59 species belonging to 46 genera from 24 families. The most diverse are Cyprinidae and Gobiidae: ten species each and three families. Clupeidae, Percidae and Mugilidae are represented by four species each. Certain species are of the freshwater origin, such as the brackish and marine euryhaline species. Marine species dominate accounting for 46% of total species. The pelagic species abundance is mostly formed by the thermophilic and marine species, such as the Azov and Pontic Sea anchovy (Engraulis encrasicolus maeoticus, E. e.ponticus) and the Black Sea large sand smelt (Atherina pontica). In smaller quantities, the Black Sea horse mackerel (Trachurus ponticus), the Black Sea garfish (Belone euxini), occasionally golden grey mullet (Liza aurata), flathead mullet (Mugil cephalus) and rarely bluefish (Pomatomus saltatrix) could be detected. As for demersal fish, most common are red mullet (Mullus barbatus ponticus) and stingray (Dasyatis pastinaca), while the families of Blenniidae, Syngnathidae are well present in the coastal zone, and Labridae - occasionally. The marine boreal species sub-group consists of six species and subspecies: inhabiting the Azov Sea permanently are the Azov sea turbot (Psetta torosa), the Black Sea flounder, three-spine stickleback (Gasterosteus aculeatus), and a relatively rare Black Sea turbot (Psetta maeotica) and the Black Sea whiting (Merlangius euxinus). Occasionally, a considerable number of the Black Sea sprats (Sprattus sprattus) may be caught by a pound net. Marine species group also includes the Far Eastern haarder (Liza haematocheila) deliberately introduced into the Azov and Black Seas from the Far Eastern region.
The brackish-water fishes form a special group of the Azov Sea fauna (11 species and sub-species) constantly dwelling in the basin. They are the Ponto-Caspian relicts, i.e., the brackish fauna "fragments" originating from the Pliocene Pontic Sea-lake. The Pelagic Azov Sea sprat (Clupeonella cultriventris cultriventris) is most popular among the sub-species. Within this group, the best presented is the Gobiidae family consisting of nine species with round goby (Neogobius melanostomus) among them which is the most frequently present and accounts for the highest recorded numbers in catches. Occasionally, the Azov perkarina (Percarina maeotica) could be detected in small quantities.
Eight species of migratory fish, mostly anadromous, are present, and they spawn in the rivers and fatten in the sea. This group includes catadromous eel (Anguilla anguilla) as well. Almost all the migratory fish has commercial importance. Overfishing and negative anthropogenic impact have resulted in the fish populations currently catastrophic situation status. This primarily concerns great sturgeon (Huso huso), i.e., the Russian (Acipenser gueldenstaedti) and starred (A. stellatus) sturgeon, the Azov shemaya (Alburnus mento), relatively rare vimba bream (Vimba vimba), as well as migratory shads (gen. Alosa).
A group of semi-migratory fish consists of seven species, mainly from the Cyprinidae family: bream (Abramis brama), common carp (Cyprinus carpio), Prussian carp (Carassius gibelio), ziege (Pelecus cultratus), saber fish (Rutilus rutilus heckeli), wells catfish (Silurus glanis) and pikeperch (Stizostedion lucioperca). These species may be detected in the Kerch Strait front area, though, sporadically.
Freshwater fishes may be in small numbers detected in catches mostly during the river discharges increase. The following belong to two families and six species: Cyprinidae, i.e., rudd (Scardinius erytrophthalmus), grass carp (Ctenopharyngodon idella), and carp (Cyprinus carpio); Percidae, i.e., European perch (Perca fluviatilis), Don ruffe (Acerina acerina); and Esocidae, i.e., Northern pike (Esox lucius).
No serious changes were witnessed in structure of the coastal fish communities inhabiting the Cazantip and Arabatskiy Bays that could be directly linked to the Kerch Strait oil spill accident.
RU: AzNIIRKH. January-December 2008
There were different programs conducted by AzNIIRKH in 2008 to produce materials for the biological communities condition status assessment within the Kerch Strait, and the Azov and Black Seas adjacent areas after the Kerch accident (Tab. 8.7a), (Korpakova I.G., Agapov S.A., 2008).
Table 8.7a. AzNIIRKH programs of research in the Kerch Strait and the Azov and Black Seas to study the impact of the Kerch accident on the living resources status during 2008.
| Area of investigation | Works program title | Period of works |
| Azov Sea | Measuring trawl survey over the ground fish stock assessment. Daily stations to study fish feeding. | July-August,September-October |
| Measuring trawl survey over the so-iuy mullet and assistant fish species stock. | February-April,November-December | |
| Quality conditions status evaluation of semi-migratory and assistant fish species. | April-June | |
| Lampara, ichthyoplankton and zooplankton measuring surveys | June, August | |
| Evaluation of goby stock and its distribution in the coastal zone | August-November | |
| Complex oceanographic survey and implementation of state monitoring program to assess anthropogenic pollution of the water and bottom sediments | April-October | |
| Investigations into the so-iuy mullet population wintering, distribution and condition status | January-April,October-December | |
| Investigations into the pontogammarus population condition status and evaluation of its reserves. | June-August | |
| Kerch Strait | Quantitave and qualitative characteristics, abundance, seasonal distribution and migration, and evaluation of the water bioresources commercial usage (observation and control sites). | January-December |
| Migrations time clarification and yield evaluation, as well as investigations into the sea and migratory fish condition status in the Kerch Strait to include the Taman and Dinsky Bays. | January-December | |
| Black and Azov Seas | The macrophyte and rapana reserves assessment. | June-October |
| Black Sea | Control over migratory anchovy and its wintering concentrations. | January-April, October-December |
| Control over the sea fish reserves and evaluation of its reproduction efficiency. | May-June,August-September | |
| Control over scad migratory and wintering concentrations, its stock assessment. | January-February,November-December | |
| Complex oceanographic survey and implementation of state monitoring program to assess anthropogenic pollution of water and bottom sediments. | May-September | |
| Quantitave and qualitative characteristics, abundance, seasonal distribution and migration, and evaluation of the water bioresources commercial usage (observation and control sites). | January-December | |
| Sea fish stock and distribution assessment in the Kerch-Taman shelf area within the Russian territorial waters and economic zone to include the “Anapa banka”. | March-September |
Pelagic species were studied for fatness, 12 commercial species (4,415 individuals in total) were biologically investigated (weight, gender, content of stomach, age, physiological, biochemical, histological, toxicological and other analyses) and more than 67,000 individuals from different species were measured for length identification (populations size structure).
Dogfish. In the Kerch Strait proper, dogfish is rare and during the fishing season a couple of individuals of this species could be occasionally detected in the so-iuy mullet set-net and gray mullet net catches. To specify dogfish concentration in the Black Sea Kerch-Taman areas adjacent to the Kerch Strait, dogfish average catches (kg) per tug (1 trawling hour) of standard sprat trawl of up to 31 m depth measuring were taken as indicators (Tab. 8.7b). During the 2005-2007 period, a tendency for certain dogfish concentration increase in the pre-Kerch Strait area was witnessed. In 2008, according to the carried out research results, the trend was sustained.
Table 8.7b. Dogfish distribution in May-June 2005-2008 in the Black Sea shelf section adjacent to the Kerch Strait, kg/h trawling (Korpakova I.G., Agapov S.A., 2008).
| Depth, m | 2005 | 2006 | 2007 | 2008 | ||||
| average | range | average | range | average | range | average | range | |
| 21–30 | 14.8 | 0–156.3 | 28.6 | 0–305.0 | 62.9 | 0–234.0 | 23.9 | 0–80.5 |
| 31–40 | 0.3 | 0–5.5 | 3.8 | 0–34.1 | 0 | – | 36.1 | 0–155.0 |
| 41–46 | 0 | – | 2.8 | 0–44.6 | – | – | 0 | – |
| Total in area | 5.3 | 0–156.3 | 9.7 | 0–305.0 | 34.9 | 0–234.0 | 28.0 | 0–155.0 |
Buckler skate or sea-fox (Raja clavata L.). Sea-fox is a ground fish predator originating from the boreal and arctic zoogeographic complex and it dwells in cool waters of up to 100 m deep the year round. In the course of conducted in May-September 2008 two measuring trawl surveys, sea fox was continuously detected during the observation period at the depth ranging from 21 m to 46 m. In May-September, the grown-up species only were detected. Juveniles were recorded in small numbers and their share accounted for 1.3% of the sea-fox catches subtotal (Tab. 8.7c). In recent years, sea-fox concentration in the Kerch pre-strait area has got a tendency for increase, and 2008 was no exception.
Table 8.7c. Sea-fox skate distribution in May-June 2005-2008 in the Black Sea shelf section adjacent to the Kerch Strait, kg per tug (1 trawling hour) of standard sprat trawl (Korpakova I.G., Agapov S.A., 2008).
| Depth, m | 2005 | 2006 | 2007 | 2008 | ||||
| average | range | average | range | average | range | average | range | |
| 21–30 | 0.43 | 0–4.20 | 3.46 | 0–28.90 | 2.10 | 0–10.50 | 6.30 | 0–10.80 |
| 31–40 | 0.44 | 0–4.74 | 0.83 | 0–6.00 | 5.80 | 0–17.20 | 11.10 | 0–43.40 |
| 41–46 | 0 | – | 0.76 | 0–6.36 | – | – | 0 | – |
| Total in area | 0.35 | 0–4.74 | 1.46 | 0–28.90 | 3.74 | 0–17.20 | 8.17 | 0–43.40 |
Sting ray or sea-bear (Dasyatis pastinaca L.). Sting ray is a warm-water ground fish originating from the Mediterranean zoogeographic complex and it preferably dwells on sandy bottoms at the low or moderate depth of 10-20 m. During the cold year time it goes down from the surface to up to 90 m; takes lengthy migrations along the Black Sea coast. In summer, its Black Sea stock partially migrates for fattening to the Azov Sea through the Kerch Strait. Both skates are relatively large predators (Tab. 8.7d). Sting ray could be regularly detected both in the Kerch Strait proper and in the Taman and Dinsky Bays, where its main feeding are the gobies.
Table 8.7d. Skates average mass-and-size parameters for the Black Sea area adjacent to the Kerch Strait in 2005-2008 (Korpakova I.G., Agapov S.A., 2008).
| Year | Sea-fox | Sea-bear | ||
| disc diameter, сm | mass, kg | disc diameter, сm | mass, kg | |
| 2005 | – | – | – | – |
| 2006 | 44.5 | 4.3 | – | – |
| 2007 | 45.5 | 4.1 | 33.0 | 2.8 |
| 2008 | 43.3 | 4.4 | 37.3 | 3.3 |
The Black Sea sprat (Sprattus sprattus phalericus Risso). Sprat is a typical Black Sea fish that could be detected in the Kerch Strait during the cold year period only in rather large quantities (Tab. 8.7e). In 2008, sprat massive after-spawning arrival to the Black Sea shelf occured in the third decade of March that was compatable with the multiannual data. In that period sprat may often make joint stocks with anchovy shoals. Their selected mixed stocks may be seen in April, when anchovy spring migration to the Azov Sea takes place.
Table 8.7e. Sprat distribution in May-June 2005-2008 in the Black Sea shelf section adjacent to the Kerch Strait, kg/h trawling (Korpakova I.G., Agapov S.A., 2008).
| Depth,m | 2005 | 2006 | 2007 | 2008 | ||||
| average | range | average | range | average | range | average | range | |
| 21–30 | 702 | 95–1,980 | 573 | 67–1170 | 145 | 50–370 | 425 | 0-1,133 |
| 31–40 | 867 | 70–2,150 | 789 | 234–3645 | 482 | 263–839 | 374 | 196–500 |
| 41–46 | 524 | 200-1,330 | 965 | 198-1,870 | – | – | 555 | – |
| Total in area | 741 | 70-2,150 | 773 | 67-3,645 | 295 | 50–839 | 410 | 0-1,133 |
During the last years a clear tendency of sprat stock reduction in the Black Sea Russian territorial area was recorded. Apparently, the trend is triggered by climatic changes and reconstruction of trophic chains in the Black Sea biological communities. In 2008, according to the carried out research results, a tendency for sprat stock stabilization with growth in certain sea areas has started to emerge. One of those areas is a section of the Black Sea Kerch-Taman area adjacent to the Kerch Strait.
The Black Sea whiting (Merlangius merlangus euxinus Nordmann). Whiting is a cold-water species originating from the cod family and is just another representative of the Black Sea boreal and arctic relics. Concentrations of mature species could be most often detected in the 30-40 m deep shelf sections where the water temperatures hardly experience serious seasonal changes (Tab. 8.7f).
Table 8.7f. Whiting distribution in May-June 2005-2008 in the Black Sea shelf section adjacent to the Kerch Strait, kg/hour trawling (Korpakova I.G., Agapov S.A., 2008).
| Depth,m | 2005 | 2006 | 2007 | 2008 | ||||
| average | range | average | range | average | range | average | range | |
| 21–30 | 8.1 | 0.1–67.0 | 6.7 | 0–30.0 | 0.5 | 0–2.6 | 1.3 | 0–6.5 |
| 31–40 | 24.9 | 1.6–110.0 | 11.4 | 1.7–33.0 | 9.9 | 3.1–14.3 | 22.2 | 15.0–28.0 |
| 41–46 | 10.7 | 0.4–30.0 | 17.4 | 2.0–51.0 | – | – | 45.0 | – |
| Total in area | 16.2 | 0.1–110.0 | 11.5 | 0–51.0 | 4.7 | 0–14.3 | 15.4 | 0–28.0 |
As became evident, whiting – the same as sprat – in recent years has experienced a trend for stock reduction. In 2008, we witnessed a certain whiting stock increase in the Black Sea shelf selected areas to include certain sections of the Kerch-Taman area adjacent to the Kerch Strait.
The Black Sea turbot (Psetta maeotica maeotica Pallas). Turbot is one of the most valuable commercial species of the Black Sea ichthyofauna. It is a cold boreal and arctic complex representative. The data received has clearly shown a trend for the turbot stock increase in the shelf section under investigation (Tab. 8.7g). In 2008, the stock increase trend was sustained in the mentioned area.
Table 8.7g. Turbot distribution in May-June 2005-2008 in the Black Sea shelf section adjacent to the Kerch Strait, kg/h trawling (Korpakova I.G., Agapov S.A., 2008).
| Depth,m | 2005 | 2006 | 2007 | 2008 | ||||
| average | range | average | range | average | range | average | range | |
| 21–30 | 0.8 | 0–9.5 | 2.7 | 0–8.5 | 4.5 | 0–11.7 | 1.2 | 0–5.8 |
| 31–40 | 0.9 | 0–7.1 | 6.2 | 0–32.0 | 2.5 | 1.5–4.8 | 15.6 | 0–48.4 |
| 41–46 | 2.1 | 0–8.0 | 6.2 | 0.7–17.9 | – | – | 5.4 | – |
| Total in area | 1.1 | 0–9.5 | 5.3 | 0–32.0 | 3.7 | 0–11.7 | 8.7 | 0–48.4 |
Horse mackerel (Trachurus mediterraneus ponticus Aleev). The Black Sea horse mackerel originates from ichthyofauna of the Mediterranean zoogeographic complex. It is a mass, warm-water pelagic species with a wide range of abundance in the investigated areas (Tab. 8.7h).
Table 8.7h. Horse mackerel distribution in May-June 2005-2008 in the Black Sea shelf section adjacent to the Kerch Strait, kg/h trawling (Korpakova I.G., Agapov S.A., 2008).
| Depth,m | 2005 | 2006 | 2007 | 2008 | ||||
| average | range | average | range | average | range | average | range | |
| 21–30 | 0.235 | 0–1,900 | 0 | – | 0.005 | 0–0.023 | 63,000 | 9.0–97.2 |
| 31–40 | 0.001 | 0–0.012 | 0 | – | 0 | – | 2,900 | 0–8.9 |
| 41–46 | 0.005 | 0–0.050 | 0 | – | – | – | 0 | – |
| Total in area | 0.084 | 0–1,900 | 0 | – | 0.003 | 0–0.023 | 27,700 | 0–97.2 |
Mullet (Mullus barbatus ponticus Essipov). The Black Sea mullet is a warm-water representative of the Black Sea ichthyophauna Mediterranean complex and it preferably dwells in the areas with temperature exceeding 8°С and salinity ranging from 13% to 18%, while avoiding the highly desalted areas. The North-Caucasian mullet stock is characterized by lengthy spawning and fattening periods, and wintering migrations and it largely dwells in the Russian territorial waters. According to research data, total abundance of the mullets entering for fattening the Azov Sea has changed in the last three years from 450 thousands (2005) to 28 mln individuals (2006) reaching 5.2 mln individuals in 2007. The North-Caucasian mullet stock has a clear two-year periodicity in production of abundant offspring, and in 2008 a low abundance of juveniles was expected.
The Azov-Black Sea bluefish. In the Azov and Black Seas territorial waters three types of the Azov-Black Sea bluefish are present. Of them, golden mullet (Liza aurata Risso) is the most popular, while flathead mullet (Mugil cephalus L.) is rarer and gray mullet (Liza saliens Risso) is detected just occasionally. Blue fish present in the Russian territorial waters comfortably spends winters in the Crimean and Caucasian relatively deep-water bays well protected from the winds.
Table 8.7j. Abundance and biomass of age groups of commercial golden mullet in 2005-2007 (Korpakova I.G., Agapov S.A., 2008).
| Age | 2 (2+) | 3 (3+) | 4 (4+) | |||
| Year | th ind. | tons | th ind. | tons | th ind. | tons |
| 2005 | 25.6 | 5.3 | 126.6 | 42.8 | 23.3 | 11.1 |
| % | 14.1 | 8.3 | 69.6 | 67.2 | 12.8 | 17.4 |
| 2006 | 44.7 | 8.9 | 78.1 | 22.7 | 102.5 | 40.3 |
| % | 15.1 | 8.4 | 26.4 | 21.2 | 34.6 | 37.9 |
| 2007 | 3.6 | 0.8 | 37.1 | 9.6 | 39.8 | 14.0 |
| % | 4.2 | 3.1 | 43.8 | 36.6 | 47.0 | 53.4 |
| Age | 5 (5+) | 6 (6+) | total | |||
| Year | th ind. | tons | th ind. | tons | th ind. | tons |
| 2005 | 6.0 | 4.2 | 0.4 | 0.3 | 181.9 | 63.7 |
| % | 3.3 | 6.6 | 0.2 | 0.5 | 100 | 100 |
| 2006 | 52.1 | 24.7 | 18.6 | 9.6 | 296.0 | 106.2 |
| % | 17.6 | 23.3 | 6.3 | 9.2 | 100 | 100 |
| 2007 | 4.2 | 1.8 | – | – | 84.7 | 26.2 |
| % | 5.0 | 6.9 | – | – | 100 | 100 |

Fig 8.7a. The October 2007 golden mullet 1+ age distribution in the Azov Sea, vertical scale gradation in thousand individuals/km2 (Korpakova I.G., Agapov S.A., 2008).
In 2008, the golden mullet bag-net catches by 96.3% consisted of the two-year old species, whose size varied from 13.5 cm to 18.5 сm and mass – from 26 g to 76 g averaging 15.7 сm and 42 g accordingly (Tab. 8.7i).
Table 8.7i. Golden mullet’s size and mass composition per age groups in May 2008 (Korpakova I.G., Agapov S.A., 2008).
| fishing gear | age, years | gender, % | ||||||
| 2 | 3 | 4 | 5 | 6 | male | female | ||
| bag nets, 16 mm cell mesh | L, сm | 15.7 | 23.3 | – | – | – | 0 | 18.5 |
| М, g | 42 | 144 | – | – | – | |||
| set nets,45-50 mm cell mesh | L, сm | – | 23.1 | 28.5 | 34.6 | 38.7 | 6.8 | 93.2 |
| М, g | – | 144 | 357 | 498 | 767 | |||
In 2008, the Azov-Black Sea bluefish migrations in the Kerch Strait area remained traditional, while the bluefish Taman Bay presence and catches per tug stood at the levels registered prior to the Kerch Strait catastrophe, according to the carried out research results.
Goby (Gobiidae). In the Azov Sea basin, 15 goby species are present, though only five of them are in the list of commercial species. All goby species permanently inhabit the waters of the Kerch Strait, and the Taman and Dinsky Bays. On the annual basis, the Azov Sea goby catches broadly varied from 50 tons (1943) to 90 thousand tons (1958). The maximal catches were recorded in the end of the 1950s and beginning of the 1960s, i.e., 50-90 th.tons. Later on, they went down in numbers to account for 1 th.tons only in the 1980s-1990s resulting out of substantial goby stock reduction due to the sea waters salinity increase of up to 11.5-12.5‰, spawning sites silting in the 1970s and experienced in the 1950s-1960s heavy overfishing. In those years, fishing continued going on as well during the periods of anoxic situation observed in certain sea areas. Up till the 20th century end, goby stocks remained depressed and started recovering in the last five years only thanks to the experienced by the sea lower salinity (larger rivers discharge and rainfall) that reached the gobies acceptable levels of 10-11‰. In 2007, the Russian and Ukrainian goby catches stood at 7,083.9 tons. According to the carried out research, the 2008 gobies distribution, migration and concentration in the Kerch Strait area remained typical and at the previous year levels.
So-iuy mullet (Liza haematocheilus Temminck et Schlegel). So-iuy mullet is a relatively new species for the Azov-Black Sea area. Its self-reproducing population emerged in the Azov Sea in the end of the 1980s and the Kerch Strait has become its prime migration area (its wintering goes on in the Black Sea and reproduction – on the Don River). In the recent years, the Azov so-iuy mullet abundance and stock went up from 5 mln undividuals in 1996 to 30 mln in 2005 currently remaining at a reasonably stable high level.
Presently, so-iuy mullet is in the process of becoming the prime commercial species in the Azov Sea due to dramatic decrease in abundance of indigenous migratory and semi-migratory commercially-valuable fish species of the Azov basin. In 1997-2007, the Azov Sea so-iuy mullet catches varied within the range of 3.5-12.3 th.tons. Russian share accounted for roughly one third of its jointly with Ukraine so-iuy mullet Azov Sea catches.
Table 8.7k. So-iuy mullet and herring abundance in the Azov Sea area adjacent to the Kerch Strait (thousand individuals) and their share (%) in the total Azov Sea populations abundance in 2005-2008 (Korpakova I.G., Agapov S.A., 2008).
| years | 2005 | 2006 | 2007 | 2008 |
| so-iuy mullet | 11,858 | 2,561 | 3,560 | 6,244 |
| % | 25.23 | 21.45 | 40.81 | 48.48 |
| herring | 707 | 878 | 292 | 1,658 |
| % | 8.1 | 16.6 | 2.4 | 13.8 |
The carried out in 2008 research revealed no negative impact of the Kerch accident on the so-iuy mullet specifics of distribution, traditional migration and biological characteristics in the Kerch Strait and the adjacent Azov and Black Seas.
The Azov-Black Sea migratory herring (Alosa immaculata Bennet) is a species whose average life cycle does not exceed eight years. Herring spends its winter and the first year of life by the Black Sea Caucasian coast. Some of the one-year old fishes go for fattening to the Azov Sea.
In 2005-2007, the mixed-age herring abundance kept changing from 292.6 to 707.5 thousand individuals in the water basins adjacent to the Kerch Strait that accounted for from 2.4% to 16.6% of the population abundance subtotal.
In autumn 2007, a small part of the herring population went for wintering to the Black Sea prior to the Kerch Strait accident, while its larger part migrated there afterwards.
Herring’s total abundance and commercial stock increased in 2008 thanks to its young generations increased capacity in survival during wintering (more favoutable environment conditions) to eventually result in its density increase at the fattening sites. In summer 2008, herring abundance in the pre-strait area stood at 1,658.3 th.ind. Thus, the 2008 research did not reveal any negative impact of the Kerch accident on the herring population condition status and hence on fishing effort.
Anchovy. The Azov anchovy spends its spawning and fattening seasons in the Azov Sea, while migrating for wintering to the Black Sea. The anchovy autumn 2007 migration from the Azov to the Black Sea through the Kerch Strait started in mid-October and proceeded further on after the devastating November storm as well. Unexpectedly, the 16-19 November catches from migration route sections appeared to be higher than those before the storm and often reached 15-25 tons. The two-three year old anchovy species accounted for 75% of abundance, while making the catch base. Anchovy juveniles were hardly present in the catches. Having 19 seiner boats and focused at the Kerch processing enterprises, Ukrainian fleet was industrious in fishing out those anchovy shoals and managed to catch 4,600 t during November, including 2,800 t after the Kerch Strait accident, having fully exhausted its national quota.
By the 2008 beginning, main anchovy mass had formed its wintering gatherings in the Anapa-Utrish part of the Kerch-Taman area that usually happens just occasionally (less than once in 10-15 years). Domination in the stock of larger-size elder-group individuals (two-four years old), anchovy’s high fat content (14-18%) in January, good commercial quality of the product, as well as proximity of coastal storage and processing facilities contributed to productive performance of the Russian fishing fleet. As of 16 March, the Azov anchovy catches stood at around 5.1 th.tons (34% of national quota) starting from the 2008 beginning. This fishing commercial indicator appeared to be the highest for the last decade.
Therefore, data on anchovy stock migrations through the Kerch Strait during and after the oil spill accident reveal quite a good population condition status. Continuously good commercial quality of the product, increasing intensity of fishing in the Russian and Ukrainian coastal waters after the accident provide no evidence about the oil spill negative impact experienced by anchovy population or its commercial value loss. For anchovy stock condition status, its abundance dynamics and catches, the shipwrecks and sulphur or oil-spill aftereffects remained either undetected, or unobservable against the fishes year cycles and natural dynamics of populations abundance.
Table 8.7l. Anchovy spawning season biomass and density in different Azov Sea areas (Korpakova I.G., Agapov S.A., 2008).
| Year | Biomass, thousand tons | Density, kg/km2 | ||||||
| areas | areas | |||||||
| pre-strait | sea proper | Taganrog Bay | total stock | pre-strait | sea proper | Taganrog Bay | areal average | |
| 2005 | 1.93 (7.4) | 23.07 (89.1) | 0.90 (3.5) | 25.90 | 1,600 | 750 | 280 | 740 |
| 2006 | 1.34 (5.1) | 23.85 (90.3) | 1.21 (4.6) | 26.40 | 1,120 | 750 | 430 | 760 |
| 2007 | 2.11 (3.8) | 52.39 (94.7) | 0.80 (1.5) | 55.30 | 1,760 | 1,700 | 880 | 1,590 |
| average | 1.79 (5.4) | 40.79 (91.4) | 0.97 (3.2) | 36.20 | 1,493 | 1,066 | 266 | 1,030 |
| 2008 | 5.47 (7.3) | 68.64 (91.5) | 0.89 (1.2) | 75.00 | 4,560 | 2,230 | 320 | 2,470 |
Note: The share (%) of area biomass from the stock subtotal is given in brackets.
Table 8.7m. Anchovy spawning season biomass and density in different Azov Sea areas (Korpakova I.G., Agapov S.A., 2008).
| Year | Biomass, thousand tons | Density, kg/km2 | ||||||
| areas | areas | |||||||
| pre-strait | sea proper | Taganrog Bay | total stock | pre-strait | sea proper | Taganrog Bay | areal average | |
| 2005 | 8.40 (15.7) | 37.40 (70.0) | 760 (14.3) | 53.40 | 7000 | 1,220 | 1,690 | 1,460 |
| 2006 | 0.90 (1.5) | 59.86 (97.5) | 0.64 (1.0) | 61.40 | 750 | 1,940 | 130 | 1,670 |
| 2007 | 0.86 (1.1) | 73.39 (94.7) | 3.31 (4.2) | 78.10 | 720 | 2,400 | 680 | 2,120 |
| average | 3.38 (6.1) | 56.88 (87.4) | 3.86 (6.5) | 64.30 | 2,823 | 1,853 | 833 | 1,750 |
| 2008 | 0.19 (0.1) | 162.71 (93.0) | 12.10 (6.9) | 175.00 | 160 | 5,200 | 2,330 | 4,700 |
Note: The share (%) of area biomass from the stock subtotal is given in brackets.
Later on in 2008, anchovy reproduction conditions turned out to be less favorable than in the previous years. The main stock reproduction limiting factor became the lack of sufficient feeding necessary for its larvae survival. For the successful anchovy recruitment to arrive, the naupliar stages copepoda abundance is required to be no less than 30.0 th.ind./m3. During the whole summer of 2008, their number never exceeded 1.0 th.ind./m3 (natural fluctuations, non-related to the Kerch Strait accident). Respectively, the 2008 generation of anchovy was estimated as 10 billion individuals, which was a low level of recruitment of the population indeed.
UA: IBSS. 2006-2009. According to parasitological studies conducted, massive death of the girodaktilyus type parasites was registered to occur on the skin of fish caught in the Kerch Strait right after the accident. It is well known that mucus covering the fish skin may serve as nutrition source for monogeneans, while being a good sorbent. Therefore, the parasites death may be well attributed to petroleum hydrocarbons absorption by the fish skin mucus. The monogeneans species composition and presence on the whiting skin recorded later in May 2008 did not reveal any change in their condition status observed in May 2007 prior to the Kerch Strait accident. It was obvious that ectoparasites population had quickly recovered to its baseline state.
8.9. Mass mortality of fish due to the low oxygen water presence
UA: IBSS. July 2007. During the last decades, fish mass mortality from oxygen deficiency has become a common phenomenon at the Azov Sea. Large amounts of nutrient species stem to the sea in the result of different anthropogenic activities. Correspondingly, the Azov Sea has turned into a highly-eutrophicated area. During summers, when the water is stratified and well warmed at the surface, chances for hypoxic and anoxic situations to develop increase highly. The last fish mass mortality from oxygen deficiency was registered in the period from 27 July to 1 August 2007 by the IBSS expedition carried out in the Cazantip Cape and Arabatskaya Bay coastal waters.
The day of 27 July 2007 was characterized by calm weather. In the narrow coastal zone, the surface water temperature was exceeding 30oC. Salinity varied from 10.66% at the surface to up to 10.95% at the bottom. Associated with phytoplankton active development, oxygen saturation in the surface water layers ranged from 129% to 171%, whereas in the bottom layers it was registered as 6% only at certain locations. In parallel, bacterioplankton total abundance was witnessed very high to average 6.46±2.21 million cells per ml. The maximal presence of bacteria (more than 8 million cells/ml) was detected by the Cazantip Cape Eastern shore, whereas their density in the Northern section was minimal (about 4 million cells/ml). Bacteria cells were mainly represented by the 0,113-0,268 μm3 biovolume cocci. Phytoplankton abundance had a 1.5 million cells/m3 - 35.8 million cells/m3 density while its biomass stood at 4.5 g/m3 - 104.5 g/m3. Toxic microalgae were identified as the dominant species at the most stations.
Five tons of the Azov sprat (Clupeonella cultriventris cultriventris) were found stranded onto the Azov Sea Tatar Bight shore on July 28. That was pelagic species and their mortality was not related to the oxygen deficiency. High concentrations of toxic Cyanophyceae algae, such as Anabaena knipowitschii and Aphanizomenon flos-aquae, could have been the cause of the pelagic fishes death. Blue and green algae were visibly forming colored bands on the surface of the studied area. On top of that, the Prorocentrum micans and Prorocentrum cordatum (Dinosphyceae) species, both known as potentially harmful, were found dominating in the phytoplankton biomass, while forming red tides (discoloration of water). The benthic fishes mortality observed derived from presence of hypoxia in the bottom layers of the studied areas.
In the morning of 29 July 2007, mass stranding of gobies, inactive and easily caught by hands, was observed at the Cazantip Cape and in the Arabatskaya Bay. Over the next four days, their mass mortality area had increased in size and spread along the Cazantip Cape entire coastal zone reaching certain spots at the Arabatskaya and Cazantip Bays. Four species of goby were discovered, with the round goby (Neogobius melanostomus) dominating presence of 40.2% followed by the knout goby (Mesogobius batrachocephalus) - of 29.6%, the monkey goby (Neogobius fluviatilis) – of 19.0% and the mushroom goby (Neogobius eurycephalus) – of 11.2%. The Black Sea large sand smelt (Atherina boyeri pontica) and shrimps were detected occasionally. The dead fish individuals were found everywhere: washed ashore, lying at the bottom and floating on the surface. In average, 190 dead goby individuals were found in 100 m2 area of bottom and surface waters. The dead fish patches ranged from 10 m to 40 m (25 m in average) at the bottom and from 50 m to 150 m on the surface. According to observations, the dead fish belt stretched for at least 10 km. It was difficult to calculate the commercial goby species total loss, since dead fish was distributed unevenly. By very rough estimations, the dead gobies mass off the Cazantip Cape coast ranged from 75 to 115 tons. No fish eggs or larvae were recorded.
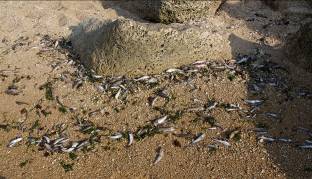
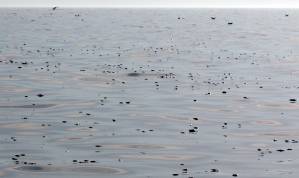
Photo. Fish mass mortality resulting from oxygen depletion registered on 29 July 2007 at the Cazantip Cape by Eugeniya Karpova
In 2008-2009, no oxygen deficiencies have been recorded, as well as mass mortality of fish has not taken place in the Kerch Strait area.
The Kerch Strait cetacean fauna is limited to the Black Sea subspecies of the bottlenose dolphin (Tursiops truncatus ponticus) and harbour porpoise (Phocoena phocoena relicta). Bottlenose dolphins form local aggregations of 80-130 individuals that leave the Kerch Strait area for the Black Sea in winter. Harbour porpoises (about 3,000 individuals) take annual migrations, leaving the Azov Sea through the Kerch Strait in autumn and returning back in spring. These movements concur with seasonal migrations of anchovy, one of the preys preferred both by the porpoises and the dolphins (Birkun A., Krivokhizhin S., 2008).
It is very likely that the Kerch Strait marine mammals were directly impacted by the Kerch accident to lesser extent than other species (e.g., sea birds). No mass cetacean strandings (i.e., mass mortality), nor live animals ashore were observed during and after the Kerch Strait catastrophe. For instance, along the Kerch Strait Ukrainian coast, during ten days in the period of 11-20 November no cetacean stranding was recorded. At the Russian coast, on 13 November two dead animals (a bottlenose dolphin and probably small harbour porpoise) were found by a clean-up team on the Chushka Spit. However, both bodies where not examined and could have been washed ashore prior to the catastrophe or could have resulted from the experienced heavy storm. Cetacean stranding is not rare in that area, and is mostly produced by the fishing gear bycatch, which is not related to such factors as local pollution. Therefore, there is no clear evidence of cetaceans mortality resulting from the Kerch Strait oil spill during the disaster or afterward.
Based on results of investigations conducted in 2007-2008 after the Kerch Strait accident and their comparison with the Kerch Strait background and baseline information, and data reflecting the ecosystem status prior the accident, the following conclusions were drawn regarding the Kerch Strait oil spill impact on the biota. The mentioned accident severely damaged bird populations in the region, as it is described in Chapter 6.3. Herewith, the Kerch Strait biocenoses got insignificantly disturbed, and the experienced impacts were not large in space and were unimportant by duration. Certain changes were registered at different trophic levels: bacteria, algae, ichthyoplankton, zooplankton, macrozoobenthos, and fish ectoparasites, but their clearly evident causal relationship with the November 2007 oil spill accident was not established. The oil-spill effect was rather traceable for zoo-, ichthyoplankton and ectoparasites only. All the registered changes lasted for no longer than six months. By 2009, the Kerch Strait ecosystem was showing no condition status differences compared to the period prior to the accident. The latter could be well explained by prompt removal of the fuel oil residue produced both by the devastating storm itself and left from the clean-up operations at the coast.
Nevertheless, the Kerch Strait and its adjacent waters have to be classified as the area of chronic and substantial pollution produced by large and numerous anthropogenic pressures presence.
Chapter 9. The Kerch Oil Spill Socio-Economic Consequences And The Management Response
Eremeev V., Boltachev A., Velikova V., Kutaeva N., Chernov V., Krutov A., Postnov A., Korshenko A., Bon A., Tarasova O., Komorin V., Denga Yu., Pavlenko N.
9.1. UA: Plan of investigation of the accident consequences and administrative management response
9.2. RU: Losses and administrative management response
9.3. Legal uncertainties and contingency planning
9.4. Economic assessments, the International Oil Pollution Compensation (IOPC) Funds and the 'insurance gap'
9.5. Outcomes and suggestions
9.1. UA: Plan of investigations of the accident consequences and administrative management response
After the first phase of the Kerch Strait accident response the urgent issue was the utilization of the collected oil polluted sand and debris. On 19 March 2008 the Cabinet of Ministers of Ukraine issued Decree No 496-p “On the Urgent Measures to Overcome the Consequences of the Natural Disaster of 11-12 November 2007 in the Kerch Strait”. The Plan of Measures to Eliminate the Catastrophe Consequences having the enironmental monitoring as an integral part of the Plan was developed as a follow up of the governmental decree. Respectively, integrated national monitoring program for the Kerch Strait with adjacent areas of the Black and Azov Seas was prepared by a joint effort of UkrSCES (Odessa), IBSS (Sevastopol), and, MHI (Sevastopol), YugNIRO (Kerch) and the specialized department of the Ministry of Emergency of Ukraine. The main tasks of the Program were the investigation of the Kerch accident consequences, preparation of the post-disaster assessments and working out of the recommendations on the mitigation measures to rehabilitate marine and coastal environment damaged by the oil spill. This document was approved by the Ministry of Environmental Protection of Ukraine and agreed at a meeting of a Governmental Commission on 13 February 2008. It was decided to start investigations in March 2008.
The UkrSCES was assigned responsible for coordination of the implementation of the Monitoring Program. The participating institutions carried out the necessary field trips and research exercise in line with this national program. Their results and findings are presented in the Chapters 5–7.
In the Ukrainian part of the Kerch Strait the collection of heavy fuel oil and contaminated sand and debris has been started by units of the Ministry of Emergency Situations of Ukraine immediately after the incident.
According to the assessment of Ukrainian authorities, about 2000 tons of total 4077 tons of heavy fuel oil carried by Volganeft-139 were spilled causing the pollution of the marine and coastal environment of the Kerch Strait and adjacent areas of the Black and Azov Seas. Based on the total volume of heavy fuel oil released from the several damaged tanks of the Volganeft-139, in the Russian Federation the quantity of oil spilled by the tanker was estimated at 1300 tons. The difference of 700 tons between the Russian and Ukrainian calculations could be explained presuming that oil was not spilled by the Volgoneft-139 tanker only, but by all ships in distress in one or another way (e.g., waste waters discharges, etc).
In the first phase of the cleanup operations 5940 tons of sand-heavy fuel oil mixture were collected: in 2007 - 4200 tons, in 2008 - 1740 tons, respectively. Somewhat later 400 tons of sand-heavy fuel oil mixture were collected in the coastal area of the Kherson administrative unit which were stored at specially organized storage places nearby village Zalizny Port, Krugloozerka and at the former plant for construction materials in the town of Genichensk. These wastes were utilized by the local authorities. More than 450 tons of sand-heavy fuel oil mixtures were collected from the coastal area of the Tuzla Island.
The decision about the location of the technological equipment designed to process the sand-heavy fuel oil mixture at the territory of the State Enterprise «Kerch Marine Trade Port» was made based on findings of the scientific and technological seminar on the selection of technology for utilization of the sand-heavy fuel oil mixture held on 24.03.2008 in the city of Kerch.
6765,350 tons of sand – heavy fuel oil mixture were transported and stored at the territory of the State Enterprise «Kerch Marine Trade Port» and it was finally processed into road paving materials by 04.12.2008 (according to the report of the State Enterprise «Kerch Marine Trade Port»).
Further on, the proposals were developed for the joint Ukrainian-Russian action plan to eliminate the consequences of the accident in the Kerch Strait and in the adjacent areas of the Black and Azov Seas, as well as to ensure safety of navigation and environmental safety in the region. These proposals were timely submitted to the attention of an established Ukrainian-Russian Commission. A detailed report on the measures taken and damage assessments in Ukraine is presented in Annex 6.
9.2. RU: Losses and administrative management response
The Kerch accident was classified as a catastrophe of the local level of importance since the volume of spilled heavy fuel oil ranged between 500-5000 tons and, consequently, the Black Sea Regional Contingency Plan was not activated. Almost immediately after the Kerch oil spill accident, the Russian National Commission to deal with elimination of emergency consequences under the auspices of the Russian Federation Ministry of Transport was established. The Commission estimated the damage inflicted by the heavy storm of November 2007, specified the required post-disaster clean-up operations, carried out numerous scientific expeditions and came up with the following conclusions:
1) five ships sank, six vessels stranded and two got damaged in result of an extreme storm on 10-12 November 2007 in the Northern part of the Black Sea;
2) 35 vessel crew members were rescued, four fatalities occurred and four crew members of the Nahichevan ship went missing;
3) in the result of the Volgoneft-139 tanker breaking apart, around 1,300-1,800 tons of heavy fuel oil spilled over and about 6,500 tons of sulfur were washed off into the sea from the Volnogorsk, Nahichevan and Kovel sunk vessels;
4) more than 664 sq. km of sea surface of the Black and the Azov Seas and about 183 km of the coastline were contaminated;
5) more than 40,000 tons of oily trash were collected from the shore;
6) more than 2.5 thousand officials and solders were involved in the clean-up operations; more than 300 units of technical equipment were used. Local and international organizations (like WWF) and many volunteers from different cities assisted the government efforts. More than 1,000 students and teachers from five Krasnodar universities took part in the operations as well;
7) around 5,487 perished birds were collected, while 111 birds got completely rehabilitated and released back to the wild;
8) within the months after the accident, high concentrations of petroleum hydrocarbons kept being registered to exceed their background measurements in marine waters and bottom sediments; increased concentrations of sulfur were found as well (no visible consequences observed);
9) during almost six months after the accident a visible impact was detected in bacteria, algae, and ichthyoplankton. Local short-time effects were observed in communities of zooplankton, microphytobenthos, macrozoobenthos and ectoparasites of fish;
10) no serious impact was observed in the large marine benthic and nekton animals, including fishes and cetaceans (dolphins).
The Russian participation in the joint Ukrainian-Russian Commission, was established by the Instruction No 1606-p on 14.11.2007 of the Government of the Russian Federation to be chaired by Mr. B.M. Korol, Deputy Minister of Transport.
The Inter-departmental Commission by Order No 163 of the Ministry of Transport of the Russian Federation of 15.11.2007 was established to deal with the consequences of the Kerch catastrophe and to investigate the causes of the ship accidents, hereinafter referred to as “the Commission“. The activity of the Commission was governed by the Regulation No 2 K-18J 30424 approved on 13.12.2007. Mr. I.E. Levitin, Minister of Transport, became the Chairman of the Commission.
The Emergency Response Center was established by Instruction No AD-141-p of 12 November, 2007 of the Federal Agency of Sea and River to manage the Kerch accident response. Based on means and facilities of the Gosmorspas Service of Russia, an Immediate Response Group of the Russian Marine and River Fleet (Rosmosrechflot) was created as part of the Emergency Center.
The “Accident Rescue and Underwater Engineering Center“of Novorossiysk was designated as the lead agency in tackling the consequences of the Kerch accident at sea. The relevant work was conducted by the Center in cooperation with the EMERCOM of Russia, Ministry of Defense of Russian Federation and “Rosmorport“.
In compliance with Decision No2 592 of 12.11.2007 of the Emergency Response Committee of the Krasnodar Kray (region) Administration manpower and equipment were urgently provided to manage the consequences of the catastrophe in the Krasnodar area.
The Ministry of Transport inter-departamental commission identified the following causes of the Kerch Strait catastrophe:
1. South-Western winds reaching max speed of 27 m/s with frequency of 0.02% were blowing in the emergency area. A rare and unexpected meteorological situation occurred that created an illusion of no presence of potential risk for the mixed (sea-river) sailing vessels regardless of the coastal service timely transmitted storm warnings. The emerged storm weather conditions, when velocity of Southern wind was reaching 35 m/s and the wave height of up to 7 m, were abnormal for the region, in general. Thus, numerous sea-river vessels crowded on the Strait were unprepared for such a storm. However, no damage was inflicted on the vessels properly designed for the see weather conditions.
2. Captains of the sea-river vessels tried to do their best through taking preventive actions to minimize potential damage but those actions turned out to be belated and inefficient.
3. The vessel crews were not sufficiently staffed with trained personnel and not equipped with the necessary technical means. Thus, the crews appeared to be not ready for taking actions under the extreme circumstances and conditions and were not able to duly use the life-saving appliances.
4. Failure by the ship owners to take the necessary measures in order to ensure maritime safety and to provide safe working conditions for the vessel crew members (non-compliance with requirements of Article 60 of the Russian Federation Merchant Shipping Code) and by the vessel captains (non-compliance with the requirements of Article 6 of the Russian Federation Merchant Shipping Code) has resulted in the following:
· the Volgoneft-139, Volgoneft-123, Volnogorsk and Nahichevan vessels were operated in the conditions of the sea waves height reaching more than 2.0-2.5 m to exceed the restrictions established (imposed) by the Russian River Register;
· the Kovel vessel was operated in the sea area in contrary to the sailing area restrictions established by the Russian River Register;
· the Volgoneft-139, Volgoneft-123, Volnogorsk, Nahichevan and Kovel vessels could not timely reach the safe havens.
5. It was found out that the Kovel vessel had left its port without receiving the necessary Classification Certificate mandated to be available on board. In other words, the Kovel vessel was merely a river-going vessel not authorized to enter the sea. Thus, the Rostov-on-the Don port captain gave permission to the river vessel to conduct a sea voyage in violation of the regulations being in force.
6. The investigation and rescue facilities available in the region were not ready to function under the wind and sea conditions emerged. Actually, all investigation and rescue units failed to join the SAR operations and to leave the port due to the very extreme wheather conditions.
A detailed report on the measures taken, damage assessments and lessons learnt in the Russian Federation is presented in Annex 5.
Measures. Russia has duly analyzed at the government level the factors that caused the Kerch Strait catastrophe and the necessary legal, managerial, and financial measures were taken to improve the maritime safety and SAR. After the Kerch emergency situation, the Federal Agency of Sea and River Transport took a number of measures to improve the safety of shipping, i.e.:
1. signed the Russian-Ukrainian Temporary Agreement to establish relevant procedures for the vessels passing through the Kerch Strait (dated 17 November 2007);
2. issued a prohibition to enter to sea unless all the factors that caused the Kerch disaster were eliminated for the vessels of design similar to that of the sunken boats in the Southern part of the Kerch Strait;
3. vessels sailing under the Russian flag were inspected for compliance with the maritime safety standards in all Russian ports;
4. issued a prohibition to call at the port of Caucasus for vessels not equipped with hatch covers of approved design;
5. the Russian Maritime Register of Shipping carried out random check-ups of the 2,188 design vessels (Volnogorsk, Nahichevan) in order to assign to them a relevant class;
6. double checked the certifications issued earlier by the classification authorities to the vessels with operational restrictions.
Actions. After analyzing the causes resulted in the disaster the Ministry of Transport of the Russian Federation took the following actions:
1. the Russian Maritime Shipping Register authorities modified their requirements for vessels of mixed (sea-river) sailing;
2. the Russian River Register authorities revised the rules for areas of restricted sailing applicable for the river vessels and excluded the possibilities of their sailing within the sea areas;
3. the requirements for security of the offshore transfer complexes operations were duly adjusted;
4. certain initial actions were taken to introduce further on stricter requirements into the licensing rules applicable for shipping companies in order to improve safety of vessels;
5. rules of navigation (the sailing regulations) in the Kerch Strait were jointly elaborated by the Russain Federation and Ukraine and approved by both countries;
6. an environmental monitoring program for the Kerch Strait was developed and started being implemented.
The Russian Federation Government adopted a program for construction of specialized search and rescue boats, and auxiliary ships. In line with the program 38 boats are to be built till 2015. Also, 27 new boats are planned for delivery to the Black and Azov Seas region. Among them there would be 12 specialized boats and 15 auxiliary ships. The vessels would be kept fully prepared for the SAR operations under any weather conditions.
9.3. Legal uncertainties and contingency planning
Legal uncertainties. The delimitation of the marine borders between the Russian Federation and Ukraine is still being negotiated. This indirectly contributed to the catastrophe as well. No agreement has been reached yet between Russia and Ukraine on the search and rescue regime. The same stands for the scientific investigations in the area.
Presently, vessels receive the directions for anchoring in the waters of the Kerch Strait transfer complex from dispatchers of the Kerch traffic control center (Ukraine). In the past, the offshore fuel oil transfer complex in the Kerch Strait was supervised by a harbor master of the port of Caucasus (Russia). However, in 2006 this transfer complex was moved closer to the Ukrainian coast and fell under the supervision of the harbor master of the Kerch port (Ukraine). Thus, the Russian side lost its opportunity to improve maritime safety within the waters of the complex.
In 2004, Russia brought to the Ukrainian attention a draft agreement on co-operation in the matters of maritime investigations and rescue efforts at the Black and Azov Seas. After the Kerch Strait catastrophe the negotiations started anew. However, the final document still remains unsigned. A draft agreement between the Russian Federation Ministry of Transport and the Ukrainian Ministry of Transport on co-operation in combating oil pollution and pollution by harmful substances was submitted to the attention of the Ukrainian Ministry of Transport in 2003. As of now, no reaction to it has been received so far.
The lack of bilateral agreement on cooperation in case of transboundary emergencies between the Russian Federation and Ukraine complicated the coordinated reponse to the Kerch Strait accident.
Contingency planning. Although Ukraine and Russia are parties to the Bucharest Convention on the Protection of the Black Sea from Pollution, they have not signed yet the Regional Oil Spill Contingency Plan.
In Ukraine, in the absence of specially designed national contingency plan for oil spills in the maritime area, the contingency planning in this area is an integral part of the overall national system of preparedness and response to the emergency situations. The hazardous waste management in Ukraine is governed by the Laws of Ukraine “On Wastes” and corresponding regulations in waste management and environmental protection. In the case of the Kerch accident, upon careful consideration of possible options to process the contaminated sand and debris, the most ecologically friendly technology to convert the contaminated wastes into material for road paving was chosen.
The Russain Federation has a well developed policy for the emergency situations management. In line with the Ministry of Natural Resources Order No156 from 03.03.2003 on “Adoption of regulations on determination of the minimum level of oil and oil products spilled into the environment to classify the accident as an emergency situation”, a spill of 1 ton and more in the Black Sea area could be considered as an “emergency situation” [Order of MNR, 2003]. This document defines also the list of information manadatory to be collected when an oil spill happens: date, time and place of oil spill, the source of pollution, reason of spill, view and approximate volume of spilled oil, the area polluted, the sensitivity and socio-economy aspects of the polluted area, hydrometeorological situation, risk of the spilled oil to penetrate into the ground or surface waters, the speed and direction of the oil spill movement with estimated probability of the oil to reach the coast and, finally, the immediate actions undertaken.
The governmental Decree No 613 from 21.08.2000 (with additions from 15.04.2002) outlines major requirements for contingency planning in the Russian Federation (in Russian LARN – Plan for Liquidation of Accidental Oil Spills). Hense, the contingency plans have to include risk assessments of possible oil spills, the availability and location of equipment and human resourses for clean-up operation, the organization and logistics of actions during oil spills, governance and connections between different organizations, information exchange, the immediate actions after an oil spill notification is received, geographical and hydrometeorological features of the region where the accident happens, security of the population and medical support, etc. The plans have to be developed by the State Marine Pollution Control, Salvage & Rescue Administration of the Russian Federation (SMPCSA of RUSSIA) and agreed with the Minsitries of Energy, of Agriculture, of Defense, etc. Finally, the plans have to be adopted by the Ministries of Transport, Civil Protection and Natural Resources.
A three-tier approach was applied by Russia in developing its contingency plans (CP). The Russian Federal Plan for Oil Spill Prevention and Response at Sea was adopted by the Ministries of Transport and Natural Resources, and by EMERCOM[13]. In July 2003, the plan was reviewed, presently it is updated and expected to be enforced in 2011. A regional plan for oil spill prevention and response at the Azov and Black Seas was adopted in 1999, updated in 2003, passed almost all approval procedures in 2010 and is expected to be formally approved in 2011. As well, Russia plans to adopt the Black Sea regional CP (BS RCP) in 2011. Russian ports are provided with oil-spill response equipment, while the Russian fleet operates antipollution, survey, multipurpose and skimming vessels, as is described in Annex 4[14] of the BS RCP (http://www.blacksea-commission.org/_table-legal-docs.asp). The Russian Federation has approved two programs designed for modernization of its safe-and-rescue vessels operated by the Ministry of Transport.
9.4. Economic assessments, the International Oil Pollution Compensation (IOPC) Funds and the 'insurance gap'
Economic assessments. The economic assessment of the environmental losses is based on careful identification and calculation of all costs arising from the environmental losses induced by the event. Systematic methodologies for environmental assessments (EA) are designed to produce this kind of information (Environmental Assessment Sourcebook, World Bank, 1998). Three criteria for identifying important impacts on the environment have been suggested by the World Conservation Strategy (World Conservation Strategy, IUCN, 1980). The first of them concerns duration and geographic area where the effect could be felt. This criterion covers calculation of the number of affected people and assessing how much a particular resource could be degraded, eliminated or conserved. The second criterion is related to the urgency. It is important to establish how quickly the natural system might deteriorate and how much time is available for its stabilization or rehabilitation. Finally, it is important to assess the extent of irreversible damage to communities of plants and animals, life-support systems, and soil and water.
The next step would be to quantify all the important biophysical and socio-economic changes that are likely to result from the event. When the effects could not be quantified, they should be expressed qualitatively and incorporated into the analysis. Impacts cannot be meaningfully quantified without a basis for comparison likely to be the baseline conditions before the accident. This kind of data on conditions and trends make it possible to assess the changes directly produced by the accident.
The main goal of environmental assessment would be to foresee developments or build scenarios of the resources and environment future conditions. The purpose of the environmental assessment is to identify the potential problems and assist in the selection of the mitigation measures.
Ukraine. The only published detailed economic assessment for the Kerch accident was conducted by the ‘Oil Spill in the Kerch Strait’ project managed by UNEP (Oil Spill in the Kerch Strait, UNEP, 2008). According to its report, a direct cost assessment appeared to be quite difficult. However, the public expenditures data were used in the course of assessment to compensate for the lack of required data available. It was found that 1.62 million USD were allocated for waste processing, while a minimum of 6.6 million UAH (1 USD = 5 UAH) was calculated as the amount required for completion of the clean-up operation during the waste processing phase. Also, 0.54 million USD were allocated from the State Environment Protection Fund specifically to provide for a scientific research project on assessment of consequences produced by the marine ecosystem pollution in the result of the Kerch Strait oil spill accident.
The indirect cost assessments available were based on the assumption that the lost income of the sectors affected by the accident also covered the expected revenues of the fishery and tourism sectors (UNEP, 2008). The foregone fishery revenue was estimated at 4.1 million USD and tourism - at 4.1 million USD. Meanwhile, according to UNEP calculations, the total cost of damage has mainly derived from the fishery and tourism losses and varied in the range of 25.5 to 28.6 million USD (UNEP, 2008). That damage estimate did not cover such costs as an economic value of a clean beach and potential impacts on tourism, as well as the cost of certain required activities, such as digging out the contaminated sediments around the wreckages.
Ukraine ratified the 1992 International Convention on Civil Liability for the Oil Pollution Damage in 2002, however Ukraine became a Contracting Party to the Convention in the end of 2008 therefore provisions of the Convention were not applicable in Ukraine in the discussed period.
In Ukraine, the following two normative documents are in force and used to evaluate the cost of the damage of the marine environment from pollution by oil spilled from vessels:
1. Regulations on the Procedure for Calculating the Amount of Compensation and Payment for the Damages Caused by Pollution from the Ships, Boats and Other Floating Equipment in the Territorial Sea and Internal Waters of Ukraine (enforced by the Ministry of Ecological Safety on 26 October 1995, No116);
2. Guidance on the Calculation of Damages from Oil Pollution (enforced by the Cabinet of Ministers of Ukraine on 26 April 2003, No631).
According to the Regulations Clause 1.4, “compensation is calculated by the Main Environmental Inspectorate and Inspections of the Black and Azov Seas under the Ministry of Environmental Protection of Ukraine in US dollars based on the quantity of pollutions spilled out into the water … and taxes, approved by the Cabinet of Ministers of Ukraine on 3 July 1995, No484”. At the same time, the oil pollution tax is established as 329 USD per 1 kg of oil spilled. The scope of Regulations is determined by geographical factors (territorial sea and internal waters of Ukraine) and the origin of oil spill (ships, boats and other floating equipment).
In general, the Guidance is similar to the Regulations. However, it contains several clarifications, namely:
1. the Guidance applies to oil pollution only;
2. the scope of Guidance covers the entire territory of Ukraine beside of the territorial sea and internal waters, and the exclusive (sea) economic zone;
3. the Guidance specifies the structure of the oil pollution related total damages to include:a) losses resulted from environment pollution, including direct losses (resulting from environment degradation, losses of populations of fish and aquatic life, and food organisms, as well as damage of spawning) and lost incomes (loss of young fish, etc.);
b) costs related to renewal of the lost or to be lost natural resources;
c) preventive measures and potential losses or damage resuling from those preventive measures;
d) revenues not received due to interruption of businesses.
In Ukraine, the Ministry of the Environmental Protection estimated the economic losses from the oil pollution of the environment resulted from the wracked vessels in the territorial sea and inner marine waters of Ukraine at the total amount of 1 064 824 292 USD calculated according to the size of fines for environmental pollution (approved by the Resolution of the Cabinet of Minister of Ukraine dated 03.07.95 № 484).
Additionally, the Republic Committee for the Environmental Protection of the Autonomous Republic of Crimea made the final estimations based on the measurements of the compositions and properties of soils at the 91 control sites (calculated using the Methodology of Calculation of Losses From Pollution and Littering of the Land Resources in Case of Violation of the Environmental Legislation, approved by the Order of the Ministry of the Environment dated 04.04.2007 № 149 and registered in the Ministry of Justice on 25.04.2007 № 422/13689). Based on the analysis of the samples collected since November 2007 till April 2008 the total amount of losses from the pollution of land resources reached 432 798 366 UAH or 85 702 646 USD.
Thus, the total amount of economic losses from the pollution of the environment of Ukraine was 1 150 526 938 USD.
According to the Order of the Vise Prime Minister of Ukraine (04.2008 №18445/1/1-08) the Ministry of Justice of Ukraine was designated responsible for requesting the payments for the environmental losses resulted from the accident in the Kerch Strait and the full liability of the foreign judicial entities.
The Ministry of the Environmental Protection within its power and competence prepared a set of documents on the legal grounds and evidences in the court case of liability for caused environmental damage and submitted this set to the Cabinet of the Minister of Ukraine (letter dated 28.03.2008 № 4024/19/10-08) for further actions.
The Inter-governmental Working Group on the Preparation of the Appeal of Ukraine on the Compensation of Losses was formed according to the Procedure of Implementation of the Protection of the Rights and Interests of Ukraine During the Settling the Conflicts, Trial in the International Judicial Bodies the Cases with Participation of Foreign Entity and Ukraine (approved by the Decree of the President of Ukraine on 25.06.2002 № 581).
Right after the Kerch accident, different economic assessments were made based often on groundless assumptions, and various unrealistic figures and numbers were published in the mass-media to summarize the damage inflicted, and effects and main results of the actions taken (Table 9.4a).
Table 9.4a. Economic assessment of damages and main results of actions published in mass-media.
| Date/Country | Damage inflicted, USD | Effects | Coastcleaned-up, km | Waste collected, t |
| 12.11.2007/Ukraine | ≈ 18.5 million USD, including cost of the damage inflicted on the Crimean terrestrial resources | Dead birds, dolphins (may be collisions, not oil effect), dead molluscs, medusa | ||
| 16.11.2007/Russia | 304 billion rubles | 26 | 7,019 | |
| 20.11.2007/Russia | 20 billion rubles – assessment of scientists | |||
| 21.11.2007/Russia | 6.5 billion rubles – assessment of Rosprirodnadzor | |||
| 30.11.2007/Russia | 30 billion rubles | 5,000 birds buried | 30 | |
| 19.12.2007/Russia | - | 180 | 40,000 | |
| 11.04.2008/Russia | 20 billion rubles | 5,475 birds buried | 53 |
Russia. Russia has ratified the 1992 International Convention on Civil Liability for the Oil Pollution Damage. According to it, the clearly defined and proven damages could be considered those only that are recoverable (Chapter I, Clause 6), namely:
· costs of the undertaken reasonable measures for restoration which were actually undertaken or would be undertaken;
· preventive measures and further loss or damage of such preventive measures;
· lost profit due to the environment pollution.
The assessment of environmental losses was undertaken by the Ministry of Transport (Table 9.4b), (Booklet, 2009). Based on these assessments Russia has submitted all the necessary documents to the IOPC Fund in accordance with established procedures. The claim of Russia is in the process of consideration.
Table 9.4b. Economic assessment of damages and main results of actions (Booklet, 2009).
| Party affected / Extent of damage, in rubles (1 USD ≈ 30 Rubles) | Category | Percentage in fund | Amount of compensation from the liability limitation fund |
| Novorossiysk Bureau for Search- and-Rescue and Underwater Operations, 73,450,452 Rub. | Cleanup of sea area, towing of the stern, oil pumping out of the bow | 31.9 | 37,207,107 |
| Federal Service for Supervision of Natural Resources,6,048,000,000 rubles | Damage caused to the environment was assessed using the methodologies; Note: documents were submitted regarding expenses amounting to 300,000 rubles | ||
| Krasnodar Regional Department for Emergency Situations and State Ecological Control, 134,943,430 rubles | Shoreline cleanup | 58.60 | 68,349,106 |
| Kerch Commercial Sea port, public enterprise, 15,871,575 rubles | Accident response | 6.89 | 8,036,269 |
| Bashvolgotanker ZAO, about 5,000,000 rubles | Storage and utilization of wastes | 2.17 | 2,531,016 |
| Fund for Social and Economic Development of the Temruk Region,about 1,000,000 rubles | 0.44 | 513,201 |
Impact assessment of the catastrophic events associated with pollution of marine environment was also calculated in accordance with the Guidelines for Damage Calculation Inflicted on the Water Bodies due to violations of Water Legislation approved by the Ministry of Natural Resources on 13 April 2009 (Decision No87, the so called ‘Metodika’, on which the claims for compensations of the Russian Federation were based). The Guidelines are based on the Water Code adopted on 3 June 2006 (Federal Law No74). According to Clause 2, Purpose and Scope Chapter, the Guidelines could be applied to “calculate the damage caused to water bodies due to ... release of hazardous substances (contaminants) into the water bodies, including the oil spills …”.
According to the Guidelines, when the water bodies get by accident polluted with organic and inorganic substances, pesticides and petroleum products, the damage inflicted is calculated by the following formula:

Where Y is the damage in million rubles, Kbg is the climatic conditions factor (depending on the season), Кb is environmental factors and the water bodies status, Кin is inflation component of economic development, Кdl is duration of the negative impact produced by hazardous substances (contaminants) on a water body, Hi is the tax applicable for calculating the damage caused by the oil spills pollution (depends on the oil mass spilled). If the tank volume is known, then the pollutant mass spilled into marine environment could be determined by calculating the difference between the spilled over pollutant and the remaining in the tank.
In the case of the Kerch Strait oil spill, only one factor was taken into consideration. Therefore:
Kbg = 1.15 for November;
Кb = 1.25, if the accident site is considered located in the Azov Sea, Кв = 1.15 if the Strait is considered as a part of the Black Sea;
Кin = 1.23 according to http://www.economy.gov.ru/minec/resources/ …..macro2012_2b.xls (followed by multiplication of K2008 = 1.189 on K2009 = 1.037).
Кdl = К48 = 1.7 (start of operations to clean-up the coast from oil, Chapter 6.3), Кdl = К96 = 2.1 (beginning of pumping residual oil and fuel from the stern of Volgoneft-139, Chapter 4);
Hi = 650,000,000 rubles (according to tentative estimations, during the Kerch Strait oil spill accident in November 2007 the spilled-over mass was of 1,300 tons).
Thus, an economic damage inflicted on the Kerch Strait by the heavy fuel oil spill in November 2007 could be calculated through applying different coefficients to give the following preliminary results:
As of 1,797,480,000 Rubles = 650 * 1.15 (season) * 1.15 (for the Black Sea) * 1.7 (48 hours) * 1.23 (inflation coefficient) or as of 59.9 million USD (1 USD = 30 Rubles), and
As of 2,413,490,000 Rubles = 650 * 1.15 (season) * 1.25 (for the Azov Sea) * 2.1 (96 hours) * 1.23 (inflation coefficient) or as of 80.45 million USD.
According to the damage on marine environment compensation claims filed at the Russian arbitration courts by Rosprirodonadzor (the Russian Federation Environment Protection Supervising Authority) against the vessel owners and the lost vessels insurers, the amount claimed stood at 250 million USD.
The International Oil Pollution Compensation (IOPC) Funds. The International Oil Pollution Compensation Funds (IOPC Funds) are three intergovernmental organisations (the 1971 Fund, the 1992 Fund and the Supplementary Fund) which provide compensation for oil pollution damage resulting from persistent oil spills by tankers.
The last International Oil Pollution Compensation (IOPC) Funds meeting took place on 29 March - 1 April 2011. The focus of the meeting was to provide an update on several incidents involving the Funds. The Kerch accident was mentioned among those updates which covered important issues of law, practice and principle, and recent developments.
'Metodika' claim (see above the description under the Russian Economic Assessment). The Federal Service for the Supervision in the Sphere of the Use of Nature (Rosprirodnadzor) submitted a claim for compensation of environmental damage of RUB 6,048.6 million, based on the mass of oil spilled multiplied by the Roubles per ton amount ('Metodika'). A claim based on an abstract quantification of damages calculated in accordance with a theoretical model contradicts provisions of Article I.6 of the 1992 Civil Liability Convention (1992 CLC) and therefore is not acceptable for compensation.
In a judgement rendered in September 2010, the Arbitration Court of Saint Petersburg and Leningrad Region decided to reject the 'Metodika' claim. It was noted that in its judgement the Court had decided based on Article I.6 of the 1992 CLC that compensation for damage to the environment, other than loss of profits caused by such damage, should be limited to expenditure on reasonable reinstatement measures, as well as preventive measures and subsequent damage caused by those measures. The Court also decided that expenses included into other claims arising from the incident should cover all preventive and reinstatement measures actually taken because of the incident. Later, the 1992 Fund Executive Committee expressed satisfaction that the 'Metodika' claim had been rejected by the Court. Rosprirodnadzor did not appeal the decision of the Court and any potential appeal of the Federal Service would be belated now. The Rosprirodnazdor revised claim would mean that the CLC and Fund limits are now likely not to be exceeded, as claims to date amount to GBP 54 million.
The insurer of the Volgoneft-139 tanker pleaded before the Arbitration Court of Saint Petersburg and Leningrad Region in defence that the spill had resulted from natural phenomenon of an exceptional, inevitable and irresistible character and that the shipowner and his insurer were therefore not liable for the pollution damage caused by the spill. If this line of defence were successful, then the 1992 Fund would have been liable to pay compensation to the victims of the spill from the outset. At a hearing in September 2010 the Arbitration Court decided that the shipowner and his insurer had not provided evidence that the oil spill resulted from an act of God, exceptional and unavoidable. The Court concluded that the Master, having had all the necessary storm warnings, had not taken all the necessary measures to avoid the incident and that therefore the incident was not unavoidable for the vessels. The Court also concluded that the storm was not exceptional since the data on comparable storms in the area were available. In its judgement the Court decided that the spill had not resulted from natural phenomenon of an exceptional or inevitable character and that the shipowner and his insurer were therefore liable for the pollution damage caused by the spill.
The main outstanding issue of the Kerch accident concerns the P & I insurance which falls short of the CLC Limit of GBP 1.3 million (the 'insurance gap'). The CLC Limit is GBP 3.8 million. However, in February 2008, the Arbitration Court of Saint Petersburg and Leningrad Region issued a ruling declaring that the limitation fund had been constituted by means of a letter of guarantee for RUB 116.6 million and that the Court of Cassation and the Supreme Court had confirmed that decision, maintaining that the Russian Courts should apply the limits as published in the Russian Official Gazette. The 1992 Fund submitted pleadings asking the Arbitration Court to reconsider its earlier decision on the shipowner's limitation fund on the basis that the amendments to the 1992 CLC on the increase of the shipowner's liability limit had by that time been officially published in the Russian Federation.
In a judgement rendered in September 2010, the Arbitration Court decided to maintain the shipowner's limitation fund at RUB 116.6 million on the grounds that the amendments to the limits available under the 1992 CLC and 1992 Fund Convention had not been published in the Russian Official Gazette at the time of the incident. The Fund appealed that decision.
Although the Fund appealed the Arbitration Court's decision, the likelihood of the Fund’s appeal being successful was very slim. The Fund and the Russian Government should reach an agreement on how to resolve the insurance gap.
The Fund Director has not been authorized to make any payments for the Kerch accident yet. Presently, the problem with the 'insurance gap' remains under discussion with the Russian Government.
The Kerch catastrophe has made visible the existing deficiencies in the environment protection in the Sea of Azov and the Kerch Strait, in particular. The statements at the highest possible governmental level were made in both Russia and Ukraine about the necessity to develop and implement an environment protection and conservation program for the Azov and Black Seas.
The main ecological problems and causes of environment deterioration are well known for the Kerch Strait. It is basically the cargo transshipment from one vessel to another directly on the Strait which is a grave violation of all and every existing rules. By doing this the ship owners and captains try to reduce expenses of transshipping cargo on the Strait instead of the ports. Dozens and even hundreds of vessels are sometimes anchored on the Strait for transshipment of cargo to include fossil fuels.
Attempts to milk the market, to reduce the costs, to circumvent the customs procedures and payment of port duties result in damage to the environment of the Black and Azov Seas region.
Another vital issue is the environment management. No regular integrated environment monitoring exists on the Azov Sea and the Kerch Strait specifically. Also, the monitoring currently practiced on the Black Sea is far from perfect. Russian and Ukrainian scientists and NGOs have repeatedly tried to draw the attention of the relevant authorities to the existing problem since no proper management could be possible without a regular and integrated monitoring.
The first detailed EIA (including damage assessments) was conducted by the team of the ‘Oil Spill on the Kerch Strait Project’ financed by the EC (Oil Spill in the Kerch Strait, UNEP, 2008). According to its report, the oil released from Volgoneft-139 was identified as a heavy residual oil. It was determined that this type of oil was unlikely to acutely affect the marine ecosystem due to its chemical composition. However, it was forecasted that because of the oil physical properties, seabirds and waders inhabiting the area were very likely to become contaminated and their mortality rate might increase, which actually happened in reality.
The summary of the findings of the Kerch Strait coastal and marine assessment have initially (right after the accident) indicated the following:
· Significant amounts of oil, tar, and oil contaminating materials were found in many of the affected areas, particularly on the Tuzla Island. The oil would continue polluting the mrinne environment unless removed. Оil would slowly degrade in the winter while with the temperatures rising high it would warm-up and likely bring further contamination.
· Noticeable biological effects were not observed at the shoreline or the seabed of the Kerch Strait, and oil toxicity was likely to remain at the low level of impact. Such physical effects of oil contamination as the impaired movements in the organisms and damage to the insulating properties of birds plumage were observed as the gravest environmental impacts of the oil spill disaster on biota
· A chemical analysis of the seabed sediment samples taken during the fieldwork assessment showed the relatively high levels of petroleum hydrocarbons present in several places, particularly nearby those shorelines that had been hit by large amounts of oil. The petroleum hydrocarbons levels detected in certain areas of the Kerch Strait were high enough to cause physiological impact on the sensitive organisms.
As of now (2010), following the findings accomplished by the UkrSCES and other various Ukrainian and Russian scientific institutions, it could be ascertained that no residues of oil or sulfur trapped into the sea as a result of the 11-12 November 2007 accident could be found. It is most probable that they were flashed away by the flows from the Kerch shelf and got dispersed in the marine strata to be assimilated into marine ecosystems. At the same time the prerequisites for accidents recurrence continue remaining on the Kerch Strait due to the insufficiency of preventive measures.
Measures listed below could contribute to reducing the risk of further occurrence of environmental emergencies and sea pollutions, if implemented:
1. More active implementation of the PROTOCOL ON COOPERATION IN COMBATING POLLUTION OF THE BLACK SEA MARINE ENVIRONMENT BY OIL AND OTHER HARMFUL SUBSTANCES IN EMERGENCY SITUATIONS to the Bucharest Convention. The protocol requires revision in order to widen its geographical scope and better specify international cooperation and obligations in cases of accidents.
2. Russia and Ukraine are recommended to sign the Black Sea Regional Contingency Plan. The latter needs further development to incorporate the presently best available practices in combating the Tier 3 accidents. Areas of responsibility and ports of refuge need to be specified.
3. It is advisable for Ukraine in addition to the National Contingency Plan to develop a specific national plan for combating oil and other harmful substances in maritime area as well as access the OPRC Convention . Detailed guidance on procedures how to deal with oil spills, as well as on locations suitable for dispersant applications should be further developed in Ukraine.
4. Consider a possibility to join FUND Convention or setting up of a regional fund for prevention, control and preparedness to oil spills at the sea and on the coast and strengthen the national systems of funding in preparedness and response to emergencies.
5. Granting to the Black and Azov Seas the status of a "particularly sensitive sea area" under MARPOL 73/78.
6. Development of the Russian-Ukrainian strategic action plan for Sustainable Development of the Kerch Area and Integrated Natural Resources Management in the Azov and Black Seas.
For Russia and Ukraine, it is crucial to introduce a practice of comprehensive ecological auditing of the marine gas-oil extractions and ports operations, including anchorage and transshippments on the Kerch Strait.
The main task of the audit would be preparing an environment management analysis and evaluation report to include:
· preparedness plans and oil spills early warning systems availability;
· rules and regulations regarding meteorological conditions for transshipment operations;
· compliance with an actual necessity to take environment protection measures in line with financial and technical capacities available;
· inventory of traffic and transshipment of dangerous goods within the territorial waters of the state (in this case, Ukraine and Russia);
· inventory and certification of sources of environment pollution;
· introduce environmental impact assessment in the transboundary context of the environmentally dangerous functioning facilities and operational projects, etc.
Taking into account the ability of the currently available models to create simulations of the oil spills movement (Volovik S.P., 1996, Ovsienko S.N., 2005), it would be recommended to launch a routine monitoring of the marine environment in the Russian part of the Kerch Strait. Presently, such monitoring is carried out by Ukraine alone over its part of the Strait coastline by means of several hydro-meteorological stations. Only one station located on the Eastern coast of the Strait in Russia (the Taman MHS) carries out limited observations over the sea level, water temperature and salinity, waves height and ice coverage which is not sufficient for ensuring environment protection.
The situation that occured in November 2007 catastrophe in the Kerch Strait has revealed once again that operational calculations of the oil spills expansion to occur in case of a marine accident lack the necessary hydro-meteorological grounds that could be provided by the field observations data.
Besides the institutional strengthening process and capacity building measures required for improving the emergency situation response, it is necessary as well to develop the required decision-support tools (not only in Ukraine and Russia, but in all the Black Sea countries) to include risk assessments, use of dispersants options, models simulating the oil spill distribution, response operations recommended, etc. Access to the satellite data, the AIS data exchanges, sensitivity areas mapping, etc. are the components important for enhancing the environment safety aspects of shipping, and none of them is sufficiently attended or duly developed or operationally used in the Black and Azov Seas.
The Kerch accident has drawn attention to the problems hanging without resolution for years, since no human loss and boat wreckage could be attributed to the sea storms only. By now, almost three years have passed. Unfortunately, the miscellaneous plans on systematic improvement of the Kerch Strait navigation safety and the radio navigation means, on canals reconstruction, etc. drawn straight after the catastrophe went into oblivion. The Ukrainian Cabinet of Ministers Decree No1137 was initiated and adopted to impose on the captains and port authorities the responsibility to ensure safe navigation, and search and rescue effort at the sea. Hardly any progress was achieved in the result of this reforming, since a port facility by nature is an element of economic activity, while the main task of the port authorities would be to generate commercial profits. A port captain is entrusted with controlling the navigation safety, being a sea policeman as such, and can not be made responsible for arranging the search and rescue effort. In the countries around the world with well developed Search and Rescue Service, Maritime Administration or Coast Guard have overall command and are responsible for SAR in the sea.
The distribution of responsibilities of the local authorities for environment protection in emergency situations should be more clear and well defined as well. The lack of well defined responsibilities could potentially trigger a less coordinated response of the local authorities that may worsen the environmental threats danger because of belated response.
The carried out activities in the Kerch Strait were meant to contribute to safety and clean-up, and not to directly improve the environmental management
Ensuring the integrity of safe marine navigation and environment protection continues being unresolved on the Kerch Strait which has a most intense vessel sailing regime while being the marine, river, rail road and car road transportation corridor where severe ice conditions prevail through the winter period almost every year. Also, the Kerch Strait region is the place where political interests meet of two maritime powers, namely Russia and Ukraine. In the meantime, a Temporary Agreement on the Vessel Movement Regime on the Kerch Strait and along the Kerch-Enikale Channel signed by the Parties on 17 November 2007 has failed to become a basis for their future work yet. The mentioned agreement requires immediate attention of the Russia and Ukraine governments for its practical implementation. The regional agenda includes and waits for further development of co-operation, upgrading the Black Sea Regional Contingency Plan to include and have developed procedures to share resources in towage and oil recovery vessels, sharing of clean-up capabilities at sea and on-shore, places of refuge for ships in distress, etc. Providing the additional resources to the ports in order to strengthen their response in emergency situations and to tackle potential pollution is of crucial importance (the current capacity at the most of the ports allows to deal with oil spills of a Tier 1; for the Tier 2 and 3 emergencies no adequate resources are available). The regional approach should be further developed to efficiently deal with oil spill accidents of the Tier 2 and 3.
The shipping environment safety aspects are becoming increasingly complex all over the world. Every year, up to 50 million tons of oil are spilled into the world oceans as a result of an accident. Being the world's second largest oil producer, Russia is currently in the process of establishing itself at the international oil shipment market while exporting its oil products mostly from the Black Sea ports. For instance, about 60 million tons of oil are annually dispatched by tankers from Novorossiysk; about 30 million tons - from Tuapse; and three million tons - from the port of Caucasus. All in all, tankers carrying more than 138 million tons of oil and oil products load and unload them at the Black Sea ports of Russia and Georgia.
The threat of environmental disaster in the region has been hanging in the air.
There is one more serious reason of concern about the Black Sea oil exports. Experts believe that the situation with oil transshipment at the Russian ports is alarming since all the ports are working at the upper limit of their capacities.
River-sea class tankers ship oil along the Volga-Don channel and this oil is transshipped further to the sea-going vessels at the port of Caucasus, a port of major trade and strategic importance. The Kerch disaster did not happen all of a sudden: the port was not permitted to take up river-sea tankers for oil transshipment, still oil exporters were never stopped from chartering the river vessels.
No guarantee exists that the similar accidents would not result in the even worse pollution at the Black and Azov Seas since oil exports will continue growing. On May 12, 2005, the Russian Minister of Transport Igor Levitin approved the national transportation strategy envisaging further expansion and development of Russia’s oil export capacities at the Black Sea coast and aiming to increase oil transshipment at the port of Novorossiysk while building a new port at the Iron Horn Cape by 2010. Also, the document provides for construction of the Bosphormax large-tonnage tankers in order to increase oil shipments within the Black Sea. Thus, the Black Sea is likely to change from recreation area into an oil transshipment corridor.
Russia plans to increase its oil exports by several times, i.e., from the current 350 million tons to 550 million tons, and this generates a legitimate environmental concern. Oil film already covers 13% of the world oceans[15]. Anyways, it appears very difficult to clean the spilled over oil from the sea surface, and the researchers have not found yet a duly efficient cleaning method. In the meantime, this oil film prevents the sun rays to penetratie into the water column and slows down oxygen formation in the sea water. This tampers reproduction of phytoplankton that absorbs greenhouse gas emissions. For this reason the oil spills in the World Ocean are about to become a major element of global climate change.
Effective implementation of the relevant international conventions and protocols by the Black Sea countries is crucially important for ensuring improvements in the systems of contingency planning and response, development of strategies/procedures for financing the response measures in emergency situation and damage compensation mechanisms, as well as for strengthening the capacity of the oil spill response authorities and environmental management in emergencies in line with the best available practices of international importance.
Contact details of authors and contributors
In the preparation of this book several organizations from Russian Federation and Ukraine submitted the historical data and materials, the results of current scientific and monitoring expedition investigations, satellite images and governmental information on the activities and actions followed the major accidental oil spill in the Black Sea area in November 2007. The most valuable information was received from the organization and scientists such as:
| № | Name of organization and address | Abbreviation | Name | Occupation | Specialization* | ||
| RUSSIA | |||||||
| 1 | Special Center on Hydrometeorology and Environmental Monitoring of the Black and Azov Seas of North-Caucasian Regional Division of Roshydromet; Sevastopolskaya 25, 354057, Sochi, RUSSIA, www.pogodasochi.ru | SCHME BAS | Yurenko Yury | bereg@sochi.com | Head of marine Department | Hydrology, meteorology | |
| 2.1 | State Oceanographic Institute of Roshydromet, Kropotkinsky Lane 6, 119034 Moscow, RUSSIA, www.oceanography.ru | SOI | Korshenko Alexander | korshenko@mail.ru | Head of Lab. | Pollution, Monitoring | |
| 2.2 | SOI | Panova Anastasia | panova_anastasia@mail.ru | Scientist | GIS technology | ||
| 2.3 | SOI | Krutov Anatoly | krutov@bk.ru | Senior scientist | Pollution, applied oceanography | ||
| 2.4 | SOI | Ermakov Vitaly | ermavit@mail.ru | Senior scientist | Mapping, Data Base management | ||
| 2.5 | SOI | Ivanov Dmitry | dr.ivanov56@mail.ru | Scientist | Pollution | ||
| 2.6 | SOI | Kochetkov Vladymyr | ko4vv@hotbox.ru | Scientist | Mapping | ||
| 2.7 | SOI | Postnov Alexander | a_postnov@mail.ru | Deputy Director | Meteorology, Hydrology, Pollution, Socio-economics | ||
| 2.8 | SOI | Ovsienko Sergei | snovs@orc.ru | Head of Lab. | Mathematical modelling in geophysical application, oil spill modeling | ||
| 2.9 | SOI | Zatsepa Sergei | zatsepa@gmail.com | Senior scientist | Mathematical modeling in geophysical application, oil spill modeling | ||
| 2.10 | SOI | Ivchenko Alexander | alivch@orc.ru | Senior scientist | Mathematical modeling in geophysical application, oil spill modeling | ||
| 2.11 | SOI | Kabatchenko Ilya | wavelab1@yandex.ru | Head of Lab. | Wind waves, modeling and climate | ||
| 2.12 | SOI | Filippov Yury | ugfil@mail.ru | Senior scientist | Water dynamics, currents | ||
| Southern Branch of Shirshov’s Institute Oceanology RAS, 353467 Gelendzhik, Krasnodar Region, RUSSIA | SB SIO RAS | Chasovnikov Valery | chasovn@mail.ru | Head of Lab. | Standard Hydrochemistry, Pollution | ||
| 4.1 | FGU CherAzTekhMordirektsiya of Rosprirodnadzor of Ministry of Natural Resources and Ecology, Rubatskaya st. 1, village Alexino, 353925 Novorossiysk, Krasnodar region, RUSSIA, www.bsatmd.ru, info@bsatmd.ru | CherAzTekhMordirektsiya(ChAD) | Nasurov Akram | bsadirectorate@mail.ru | Deputy Director | Management of Pollution Monitorin | |
| 4.2 | FGU CherAzTekhMordirektsiya of Rosprirodnadzor of Ministry of Natural Resources and Ecology, Rubatskaya st. 1, village Alexino, 353925 Novorossiysk, Krasnodar region, RUSSIA, www.bsatmd.ru, info@bsatmd.ru | CherAzTekhMordirektsiya(ChAD) | Gogitidze Timur | bsadirectorate@mail.ru | Deputy Head of Department | Ecology, Chemistry Pollution | |
| 5.1 | Space Research Institute of Russian Academy of Sciences, , Profsoyuznaya str. 84/32, 117997 Moscow, RUSSIA, www.iki.rssi.ru | IKI RAS | Lavrova Olga | olavrova@iki.rssi.ru | Head of Laboratory | Remote sensing, Satellite images | |
| 5.2 | IKI RAS | Bocharova Tatiana | tabo@iki.rssi.ru | Scientist | Remote sensing, Satellite images | ||
| 5.3 | IKI RAS | Mityagina Marina | mityag@iki.rssi.ru | Senior scientist | Remote sensing, Satellite images | ||
| 5.4. | IKI RAS | Strochkov A. | astro@mail.ru | Senior Scientist | Remote sensing, Satellite images | ||
| 6 | Krasnodar Regional Center on Hydrometeorology and Environmental Monitoring of Roshydromet, Rashpilevskaya 36, 350000 Krasnodar, RUSSIA, www.kcgmc.ru | KRCGMS | Tkachenko Yury | yuyut@kubanmeteo.ru | Head of the Center | Physical oceanography | |
| 7.1 | Estuarine Hydrometeorological Station Cuban’s, Rosa Luxemburg 60, 353500 Temryuk, Krasnodar Region, RUSSIA | EHMSC | Ivanov Alexey | temrmeteo@kubanmeteo.ru | Director | Physical oceanography | |
| 7.2 | EHMSC | Derbicheva Tamara | temrhimlab@ kubanmeteo.ru | Head of Lab. | Chemistry, pollution, monitoring | ||
| 8 | Institute of Geography RAS, Moscow, 117019, Staromonetniy Lane 29 | IG RAS | Fashchuk Dmitry | fashchuk@mail.ru | Major scientist | Marine Ecology, anthropogenic influence consequensis | |
| 9.1 | Shirshov’s Institute Oceanology RAS, Nakhimovskij prospekt 36, 117997 Moscow, RUSSIA, www.ocean.ru | SIO RAS | Flint Mikhail | M_FLINT@ORC.RU | Deputy Director | Zooplankton | |
| 9.2 | SIO RAS | Kucheruk Nikita | nvkucheruk@mail.ru | Head of Lab. | Zoobenthos | ||
| 9.3 | SIO RAS | Belyaev Nikolay | ratnick@mail.ru | Scientist | Chemistry, pollution | ||
| 9.4 | SIO RAS | Shapovalova Elisaveta | esshap@gmail.com | Junior Scientist | Chemistry, pollution | ||
| 9.5 | SIO RAS | Kolyuchkina Galina | galka.sio@gmail.com | Scientist | Zoobenthos, biomarkers | ||
| 9.6 | SIO RAS | Simakova Uljana | yankazeisig@gmail.com | Junior Scientist | Macrophytobenthos | ||
| 9.7 | SIO RAS | Spiridonov Vasiliy | VSpiridonov@wwf.ru | Senior scientist | Zoobenthos | ||
| 9.8 | SIO RAS | Peresypkin, Valeriy | peresypkin@ocean.ru | Head of Lab. | Chemistry, pollution | ||
| 9.9 | SIO RAS | Khlebopashev Pavel | pvkh1999@mail.ru | Junior Scientist | Chemistry | ||
| 9.10 | SIO RAS | Sapozhnikov F.V. | gyrosigma@fromru.com | Scientist | Benthos | ||
| 10 | Russian Federal Research Institute on Fisheries and Oceanography (VNIRO), V.Krasnoselskay 17, 107140 Moscow, www.vniro.ru | VNIRO | Sapozhnikov Victor | marecol@vniro.ru | Head of Lab., prof. | Hydrochemistry | |
| 11 | White Sea Biological Station Lomonosov Moscow State University, a/ya 20, Glavpochtamt, Kandalakshsky region, Murmanskaya oblast, 184042, RUSSIA | WSBS MSU | Makarov A.V. | amakarov@wwf.ru | Engineer | Benthos | |
| 12 | Center of Environmental Chemistry, Scientific and Industrial Unit “Typhoon”, Pobeda prospect 4, Obninsk, Kaluga region, RUSSIA | Typhoon | Kochetkov Alexander | akochet@mail.ru | Head of Lab. | Analytical chemistry | |
| 9 | South Scientific Center, Russian Academy of Science, Rostov-on-Don, Russia | SSC RAS | Matishov | ||||
| 10 | AzNIRKH | ||||||
| UKRAINE | |||||||
| 1.1 | Marine Branch of Ukrainian Hydrometeorological Institute, Sovietskaya street 61, 99011 Sevastopol, UKRAINE, www.uhmi.org.ua/sub/sevastopol/ | MB UHMI | Ilyin Yuriy | mb_uhmi@stel.sebastopol.ua | Director | Regional oceanography | |
| 1.2 | MB UHMI | Shibaeva Svetlana | Scientist | Marine chemistry | |||
| 1.3 | MB UHMI | Fomin Volodymir | Head of Laboratory | Marine dynamics modelling | |||
| 1.4 | MB UHMI | Diakov Nikolay | Scientist | Marine hydro-meteorology | |||
| 1.5 | MB UHMI | Malchenko Yuriy | Scientist | Marine chemistry | |||
| 1.6 | MB UHMI | Repetin Leonid | Senior Scientist | Marine hydro-meteorology | |||
| 2.1 | Marine Hydrophysical Institute of NASU, Kapitanskaya street 2, 99011 Sevastopol, UKRAINE, www.mhi.iuf.net | MHI | Ivanov Vitaliy | vaivanov@alpha.mhi.iuf.net | Director | Marine physics | |
| 2.2 | MHI | Khmara Tatiana | Scientist | Marine physics | |||
| 2.3 | MHI | Goriachkin Yuriy | Senior Scientist | Regional oceanography | |||
| 2.4 | MHI | Lemeshko Yevgeniy | Senior Scientist | Marine physics | |||
| 2.5 | MHI | Sovga Olena | Scientific Secretary | Marine chemistry | |||
| 2.6 | MHI | Ovsianiy Yevgeniy | Scientist | Marine chemistry | |||
| 3.1 | Institute of Geological Sciences of NASU, O.Gonchara street 55-b, 01054 Kiev, UKRAINE, www.igs-nas.org.ua | IGS | Gozhik Petro | info@igs-nas.com.ua | Director | General and marine geology | |
| 3.2 | IGS | Bagriy Igor | Deputy director | General and marine geology | |||
| 3.3 | IGS | Ivanova Anna | Scientist | Geography | |||
| 4.1 | Ukrainian Scientific Center of Ecology of the Sea, Ministry of the Environment Protection, Odessa, French blvd., 89 | UkrSCES | Komorin Viktor | vkomorin@mail.ru | Deputy Director | Hydrology | |
| 4.2 | UkrSCES | Denga Yuriy | lawmd@te.net.ua | Head of Lab. | Pollution | ||
| 4.3 | UkrSCES | Zarubin Yuriy | lawmd@te.net.ua | Head of Lab. | Pollution, TPHs | ||
| 4.4 | UkrSCES | Tsymbaliuk Kirilo | lawmd@te.net.ua | Scientist | PAHs | ||
| 4.5 | UkrSCES | Khapchenko Ludmila | lawmd@te.net.ua | Scientist | Trace metals | ||
| 4.6 | UkrSCES | Vostrikova Taisa | lawmd@te.net.ua | Scientist | OCPs, PCBs | ||
| 4.7 | UkrSCES | Belozer Vasiliy | lawmd@te.net.ua | Scientist | TOC | ||
| 4.8 | UkrSCES | Zolotarev Georgiy | lawmd@te.net.ua | Scientist | Granulometry | ||
| 5.1 | Southern Scientific Research Institute of Marine Fisheries and Oceanography; Sverdlov Street 2, 98300 Kerch, AR Crimea UKRAINE, www.yugniro.crimea.com | YugNIRO | Gubanov Evgeny | yugniro@kerch.com.ua | Director | Ichtyogy, fisheries management | |
| 5.2 | YugNIRO | Trotsenko Borys | island@crimea.com | Deputy Director on Science | Regional&Fisheries oceanography, DB maintaining, GIS | ||
| 5.3 | YugNIRO | Panov Borys | yugniro@kerch.com.ua | Fisheries Oceanology Department, Head | Fisheries oceanography, forecasting, GIS | ||
| 5.4 | YugNIRO | Petrenko Oleg | yugniro@kerch.com.ua | Marine Ecosystem Protection Lab., Head | Chemistry, pollution, environmental impacts | ||
| 5.5 | YugNIRO | Zhugailo Svetlana | yugniro@kerch.com.ua | Senior Scientist | Chemistry, pollution, environmental impacts | ||
| 5.6 | YugNIRO | Smirnov Sergey | drssergius@mail.ru. | Fisheries Sector Informational Support, Head | GIS, Data Visualization,Data Formats Conversions | ||
| 5.7 | YugNIRO | Borovskaya Raisa | yugniro@kerch.com.ua | Distant Monitoring Sector, Head | Remote sensing, Satellite images interpretation, forecasting | ||
| 6.1 | Institute of Biology of the Southern Seas of NASU, Nakhimova av. 2, 99011 Sevastopol, AR Crimea, UKRAINE, www.ibss.org.ua | IBSS | Eremeev Valeriy | director@ibss.iuf.net | Director | Hydrobiology, Pollution, Socio-economics | |
| 6.2 | IBSS | Boltachev Alexander | a_boltachev@mail.ru | Deputy Director | Hydrobiology, Ichthyology, Socio-economics | ||
| 6.3 | IBSS | Mironov Oleg | msh@ibss.iuf.net | Head of Department | Oil pollution, environmental impacts, bacteriology | ||
| 6.4 | IBSS | Gaevskaya Albina | a.gaevskaya@ibss.org.ua | Head of Department | Parasitology | ||
| 6.5 | IBSS | Alyomov Sergey | msh@ibss.iuf.net | Senior Scientist | Zoobenthos | ||
| 6.6 | IBSS | Zagorodnyaya Yuliya | Artam-ant@yandex.ru | Senior Scientist | Marine zooplankton | ||
| 6.7 | IBSS | Klimova Tatyana | msh@ibss.iuf.net | Scientist | Ichthyoplankton | ||
| 6.8 | IBSS | Bryantseva Yuliya | brekall5@gmail.com | Scientist | Phytoplankton | ||
| 6.9 | IBSS | Mukhanov Vladimir | v.s.mukhanov@gmail.com | Scientist | Microbiology | ||
| 6.10 | IBSS | Rylkova Olga | olga.rylkova@gmail.com | Scientist | Microbiology | ||
| 6.11 | IBSS | Karpova Evgeniya | a_boltachev@mail.ru | Leading Engineer | Ichthyology | ||
| 6.12 | IBSS | Burdiyan Natalia | msh@ibss.iuf.net | Leading Engineer | Bacteriology | ||
| 6.13 | IBSS | Stokozov Nikolai | stokozov@mail.ru | Head of Laboratory | Physical oceanography, radionuclides | ||
| 6.14 | IBSS | Malakhova Ludmila | malakh2003@list.ru | Senior Scientist | Organochlorine compounds and polychlorinated biphenyls | ||
| 6.15 | IBSS | Kostova Svetlana | sk_kostova@mail.ru | Senior Scientist | Trace metals (mercury) | ||
| 6.16 | IBSS | Mirzoeva Nataliya | natmirz@mail.ru | Senior Scientist | Anthropogenic long–lived radionuclides | ||
Inventory of cruises and field investigations
Table A2. List of cruises and field investigations in relation with the accidental oil spill in November 2007 in the Kerch Strait.
| N | № | Project | Area** | Institution, Ministry, Place | Substrate | Parameters | Period | Number of samples/ stations | Data Owner |
| RUSSIA | |||||||||
| 1.1 | 1 | Monitoring of Russian part of the Black and Azov Seas | Coastal waters KS, BS, AZ | CUS (Cuban Estuarine Station), Roshydromet, town Temruk | Water | TPHs, Temperature | 13.11.2007– 03.06.2009 | 617/99 | SOI, Moscow, www.oceanography.ru |
| 1.2 | 2* | Monitoring of Russian part (Abrau Durso-Panagia-Cuban) of the Black and Azov Seas | Coastal waters KS, BS, AZ | Special Center on Hydrometeorology and Environmental Monitoring of the Black and Azov Seas (SCHEM BAS), town Sochi | Water | TPHs, Hydrology, Hydrochemistry, Pollution | 28.08.2003 – 15.07.2005 | 79 | SOI, Moscow, www.oceanography.ru |
| 1.3 | 3* | Monitoring of Russian part (Abrau Durso-Panagia-Cuban) of the Black and Azov Seas | Coastal waters KS, BS, AZ | Special Center on Hydrometeorology and Environmental Monitoring of the Black and Azov Seas (SCHEM BAS), town Sochi | Bottom Sediments | TPHs, Pollution | 28.08.2003 – 15.10.2004 | 3 stations | SOI, Moscow, www.oceanography.ru |
| 2.1 | 4 | Consequences of accidental oil spill | KS, BS, AZ | CherAzTehMorDirektsia, Rosprirodnadzor, MNR, city Novorossiysk | Water, Bottom sediments | TPHs, Hydrology, Hydrochemistry, Pollution | 24.07.2008-31.08.2008 | 78/43 | CherAzTehMorDirektsia |
| 2.2 | 5 | Consequences of accidental oil spill | KS, BS, AZ | CherAzTehMorDirektsia, Rosprirodnadzor, MNR, city Novorossiysk | Water, Bottom sediments | TPHs, Hydrology, Hydrochemistry, Pollution | 10.2008 | 88/75 | CherAzTehMorDirektsia |
| 2.3 | 6 | Consequences of accidental oil spill | KS, BS, AZ | CherAzTehMorDirektsia, Rosprirodnadzor, MNR, city Novorossiysk | Water, Bottom sediments | TPHs, Hydrology, Hydrochemistry, Pollution | 11.2008 | 64/36 | CherAzTehMorDirektsia |
| 3.1 | 7 | Complex marine expedition | KS | VNIRO, Moscow | Water, Bottom sediments | Hydrology, Hydrochemistry, Pollution by Petroleum Hydrocarbons | July 2008 | 38 | VNIRO, Moscow, www.vniro.ru |
| 4.1 | 8 | Complex expedition on the Taman Peninsula | TP | Southern Scientific Center RAS, Rostov-on-Don | Water, Bottom sediments, Plankton, Benthos | Salinity, рН surface, рН bottom, Oxygen concentration in surface layer (mg/l), Oxygen concentration in the bottom surface (mg/l), Pressure (kPa), CTD profiling, TPHs surface, TPHs bottom, Benthos, Zooplankton, Microzooplankton surface, Microzooplankton bottom, Phytoplankton surface, Phytoplankton bottom, Bacterioplankton surface, Bacterioplankton bottom | 16-18 November 2007 | 27 stations | Southern Scientific Center RAS, www.ssc-ras.ru |
| 4.2 | 9 | Complex expedition on the Taman Peninsula | TP | Southern Scientific Center RAS, Rostov-on-Don | Water, Bottom sediments, Plankton, Benthos | CTD profiling, Hydrochemistry, Heavy metals, TPHs surface, Benthos, Phytoplankton, Microplankton, Zooplankton | 11-13 December 2007 | 29 stations | Southern Scientific Center RAS, www.ssc-ras.ru |
| 4.3 | 10 | Diesel Icebreaker «Captain Demidov» | KS | Southern Scientific Center RAS, Rostov-on-Don | Water, Plankton | Hydrochemistry, Phytoplankton, Bacterioplankton, Mesozooplankton | 3 February 2008 | 1 station | Southern Scientific Center RAS, www.ssc-ras.ru |
| 4.4 | 11 | Complex expedition on the Taman Peninsula | TP | Southern Scientific Center RAS, Rostov-on-Don | Water, Bottom sediments, Plankton, Benthos | Hydrochemistry, TPHs surface, TPHs bottom, Zoobenthos, Picoplankton, Microplankton, Phytoplankton, Mesozooplankton | 18-21 February 2008 | 24 stations | Southern Scientific Center RAS, www.ssc-ras.ru |
| 4.5 | 12 | Complex expedition on the Taman Peninsula | KS, TP | Southern Scientific Center RAS, Rostov-on-Don | Water, Bottom sediments, Plankton, Benthos | CTD profiling, Hydrochemistry, TPHs surface, TPHs bottom, Microplankton, Phytoplankton, Mesozooplankton, Zoobenthos, | 22-26 April 2008 | 29 stations | Southern Scientific Center RAS, www.ssc-ras.ru |
| 4.6 | 13 | Complex expedition on the Taman Peninsula | TP | Southern Scientific Center RAS, Rostov-on-Don | Water, Bottom sediments, Plankton, Benthos | Hydrochemistry, TPHs, Heavy metals, Bacterioplankton, Phytoplankton, Zooplankton, Benthos, Bottom sediments | 21-25 August 2008 | 37 stations | Southern Scientific Center RAS, www.ssc-ras.ru |
| 4.7 | 14 | Complex expedition onboard RV “Deneb” | KS | Southern Scientific Center RAS, Rostov-on-Don | Water, Plankton, Benthos | CTD profiling, pH, Oxygen, Nutrients, Phytoplankton, Microzooplankton, Mesozooplankton, Picoplankton, Benthos | 13-25 April 2008 | 10 stations | Southern Scientific Center RAS, www.ssc-ras.ru |
| 4.8 | 15 | Complex expedition onboard RV “Deneb” | KS | Southern Scientific Center RAS, Rostov-on-Don | Water, Plankton | CTD profiling, pH, Oxygen, Nutrients, Phytoplankton, Microzooplankton, Mesozooplankton, Mycoplankton, Picoplankton, Ichthyoplankton | 18-24 June 2008 | 12 stations | Southern Scientific Center RAS, www.ssc-ras.ru |
| 4.9 | 16 | Complex expedition onboard RV “Deneb” | KS | Southern Scientific Center RAS, Rostov-on-Don | Water, Plankton, Benthos | CTD profiling, pH, Oxygen, Nutrients, Phytoplankton, Microzooplankton, Mesozooplankton, Jelly plankton, Picoplankton, Dissolved organic matter, Suspended organic matter, Chlorophyll, Lithology, Benthos | 06-16 October 2008 | 8 stations | Southern Scientific Center RAS, www.ssc-ras.ru |
| 5.1 | 17 | Visual observation of the coast | Crimea | IG RAS | Visual | Pollution by Petroleum Hydrocarbons | 12-14 March 2008 | - | Institute of Geography RAS |
| 5.2 | 18 | Visual observation of the coast | Crimea | IG RAS | Bottom sediments, Visual | Bottom sediments and zoobenthos pollution by Petroleum Hydrocarbons, Visual observation | 13-25 August 2008 | 41 stations | Institute of Geography RAS |
| 6.1 | 19 | Complex expedition, rubber boat | CH, AZ, DG, TB | SIO RAS | Bottom sediments, Visual | Bottom sediments and macrozoobenthos pollution, visual investigations zoobenthos and macrophytes, salinity, water temperature | 26.02-12.03 2008 | 39 stations | SIO RAS & WWF |
| 6.2 | 20 | Complex expedition, rubber boat | CH, AZ, DG, TB | SIO RAS | Water, Bottom sediments, Visual | Water and Bottom sediments pollution, Visual observation, water temperature | 16-31.07.2008 | 39 stations | SIO RAS |
| 6.3 | 21 | Complex expedition, rubber boat | CH, AZ, DG, TB | SIO RAS | Bottom sediments, Visual | Water and Bottom sediments pollution, Visual observation, water temperature | 1-15.07.2009 | 39 stations | SIO RAS |
| UKRAINE | |||||||||
| 1.1 | 22 | RV “Experiment” | KS | MHI, Black Sea Branch MSU | Water, Bottom sediments, | CTD profiling, Currents, TPHs, TM in water and bottom sediments (Fe2O3; TiO2; MnO; Cr; Сo; Cu; Ni; Zn; Pb; Sr; As; V, Cd) | 08-12 December 2007 | 5 stations | MHI, www.mhi.iuf.net |
| 1.2 | 23 | RV “YKR 10-20” | TI | MHI, Black Sea Branch MSU, MB-UHMI | Water, Bottom sediments | CTD profiling, Suspended Solids, Nutrients, Detergents, Phenols, TPHs | 28-29 February 2008 | MHI, www.mhi.iuf.net | |
| 1.3 | 24 | RV “YKR 10-20” | TI | MHI, IGS NASU, Black Sea Branch MSU | Water, Bottom sediments | CTD profiling, Geo-Morphology, Pesticides in water, TM (Fe2O3, TiO2_, MnO, Cr, Сo, Cu, Ni, Zn, Sr, V) and TPHs in bottom sediments | 14-15 March 2008 | MHI, www.mhi.iuf.net | |
| 1.4 | 25 | RV “Experiment” | KS | MHI | Water | CTD profiling, Suspended Solids | 24 March 2008 | MHI, www.mhi.iuf.net | |
| 1.5 | 26 | RV “YKR 10-20” | TI | MHI | Water | CTD profiling, Suspended Solids | 08-09 April 2008 | MHI, www.mhi.iuf.net | |
| 1.6 | 27 | RV “YKR 10-20” | KS | MHI, MB-UHMI | Water | CTD profiling, Suspended Solids, Currents (ADCP), pH, Oxygen, Nutrients, Detergents, TPHs | 21-25 April 2008 | MHI, www.mhi.iuf.net | |
| 1.7 | 28 | RV “YKR 10-20” | TI | MHI, MB-UHMI | Water | CTD profiling, pH, Oxygen, Nutrients, Detergents, TPHs | 11-12 June 2008 | MHI, www.mhi.iuf.net | |
| 1.8 | 29 | RV “YKR 10-20” | KS | MHI | Water | CTD profiling | 22-24 July 2008 | MHI, www.mhi.iuf.net | |
| 1.9 | 30 | RV “YKR 10-20” | TI | MHI | Water | CTD profiling, Geo-Morphology, | 08 August 2008 | MHI, www.mhi.iuf.net | |
| 1.10 | 31 | RV “YKR 10-20” | TI, KS | MHI | Water | CTD profiling, Suspended Solids, Currents (ADCP) | 01-05 September 2008 | MHI, www.mhi.iuf.net | |
| 1.11 | 32 | RV “YKR 10 | TI | MHI | Water | CTD profiling | 27 November 2008 | MHI, www.mhi.iuf.net | |
| 1.12 | 33 | RV “YKR 10 | TI | MHI | Water | CTD profiling, Suspended Solids, Currents (ADCP) | 9-13 December 2008 | MHI, www.mhi.iuf.net | |
| 1.13 | 34 | RV “YKR 10 | TI | MHI | Water | CTD profiling | 15 April 2009 | MHI, www.mhi.iuf.net | |
| 1.14 | 35 | RV “YKR 10 | TI, KS | MHI | Water | CTD profiling, Suspended Solids, Currents (ADCP) | 25-26 June 2009 | MHI, www.mhi.iuf.net | |
| 1.15 | 36 | RV “YKR 10-20” | KS, TI | MHI | Water | CTD profiling, Suspended Solids | 12 November 2009 | MHI, www.mhi.iuf.net | |
| 1.16 | 37 | RV “YKR 10-20” | KS, TI | MHI, MB-UHMI | Water | CTD profiling, Suspended Solids, pH, Oxygen, Nutrients, Detergents, TPHs | 4-5 December 2009 | 18 stations | MHI, MB-UHMI, www.mhi.iuf.net |
| 2.1 | 38 | 30th RV “Vladymyr Parshin” | AZ, KS | UkrSCES | Water, Bottom sediments | CTD profiling, Secci disk, pH, Oxygen, Nutrients, BOD5, Organic carbon, S, Detergents, TM, Aliphatic and aromatic PHs, PAHs, Pesticides | 30 June to 10 July 2009 | 14 stations(with NW Shelf total 23) | UkrSCES |
| 2.2 | 39 | 31th RV “Vladymyr Parshin” | AZ, KS | UkrSCES | Water, Bottom sediments | CTD profiling, Secci disk, ADCP, pH, Oxygen, Nutrients, BOD5, Organic carbon, S, Detergents, TM, Aliphatic and aromatic PHs, PAHs, Pesticides | 4-15 December 2009 | 85 stations (water), 32 (bottom sediments) | UkrSCES |
| 3.1 | 40* | Ukrainian monitoring programme | KS | MB-UHMI | Water | Pollution by Petroleum Hydrocarbons | 1981-2007 | 2075 stations | MB-UHMI |
| 4.1 | 41* | YugNIRO | KS (southern part) | Southern Scientific Research Institute of Marine Fisheries and Oceanography (YugNIRO), Kerch | Water, Bottom sediments | Water and BS pollution by TPHs, Nutrients, SS | 26.02.2002 | 27 (Water), 32 (BS) | YugNIRO |
| 4.2 | 42* | YugNIRO | KS (southern part) | Southern Scientific Research Institute of Marine Fisheries and Oceanography (YugNIRO), Kerch | Water, Bottom sediments | Water and BS pollution by TPHs, Nutrients | 29.11.2002 | 30 (Water), 16 (BS) | YugNIRO |
| 4.3 | 43* | YugNIRO | KS (southern part) | Southern Scientific Research Institute of Marine Fisheries and Oceanography (YugNIRO), Kerch | Water, Bottom sediments | Water and BS pollution by TPHs, Nutrients, SS, Plankton, Benthos | 24.05.2003 | 30 (Water), 30 (BS) | YugNIRO |
| 4.4 | 44* | YugNIRO | TI | Southern Scientific Research Institute of Marine Fisheries and Oceanography (YugNIRO), Kerch | Water, Bottom sediments | Water and BS pollution by TPHs, ChH, TM, SS, Plankton, Benthos | 22.11.2003 | 9 (Water), 9 (BS) | YugNIRO |
| 4.5 | 45* | YugNIRO | KS (southern part) | Southern Scientific Research Institute of Marine Fisheries and Oceanography (YugNIRO), Kerch | Water, Bottom sediments | Water and BS pollution by TPHs, SH, Nutrients, SS, Fe, Plankton, Benthos | 22.10.2005 | 30 (Water), 30 (BS) | YugNIRO |
| 4.6 | 46* | YugNIRO | KS (southern part) | Southern Scientific Research Institute of Marine Fisheries and Oceanography (YugNIRO), Kerch | Water, Bottom sediments | Water and BS pollution by TPHs, SH, Nutrients, SS, Fe, Plankton, Benthos | 14.11.2005 | 29 (Water), 24 (BS) | YugNIRO |
| 4.7 | 47* | YugNIRO | KS (southern part) | Southern Scientific Research Institute of Marine Fisheries and Oceanography (YugNIRO), Kerch | Water | Water pollution by TPHs, SH, Nutrients, SS, Fe | 06.09.2007 | 30 (Water), 30 (BS) | YugNIRO |
| 4.8 | 48* | YugNIRO | KS (southern part) | Southern Scientific Research Institute of Marine Fisheries and Oceanography (YugNIRO), Kerch | Water, Bottom sediments | Water and BS pollution by TPHs, SH, Nutrients, SS, Fe, Plankton, Benthos | 18.10.2007 | 12 (Water), 11 (BS) | YugNIRO |
| 4.9 | 49 | YugNIRO | KS (central part) | Southern Scientific Research Institute of Marine Fisheries and Oceanography (YugNIRO), Kerch | Water, Bottom sediments | Water and BS pollution by TPHs, S, Plankton, Benthos | 21.11.2007 | 6 (Water), 6 (BS) | YugNIRO |
| 4.10 | 50 | YugNIRO | KS (central &southern part) | Southern Scientific Research Institute of Marine Fisheries and Oceanography (YugNIRO), Kerch | Water, Bottom sediments | Water and BS pollution by TPHs, SH, Nutrients, S, Benthos | 07.02.2008 | 14 (Water), 14 (BS) | YugNIRO |
| 4.11 | 51 | YugNIRO | KS (southern part) | Southern Scientific Research Institute of Marine Fisheries and Oceanography (YugNIRO), Kerch | Water, Bottom sediments | Water and BS pollution by TPHs, TM, Plankton, Benthos | 22.04.2008 | 12 (Water), 9 (BS) | YugNIRO |
| 4.12 | 52 | YugNIRO | KS (central&southern part) | Southern Scientific Research Institute of Marine Fisheries and Oceanography (YugNIRO), Kerch | Water, Bottom sediments | Water and BS pollution by TPHs, SH, TM, SS, Plankton, Benthos | 22.04.2008 | 16 (Water), 13 (BS) | YugNIRO |
| 4.13 | 53 | YugNIRO | KS (southern part) | Southern Scientific Research Institute of Marine Fisheries and Oceanography (YugNIRO), Kerch | Water, Bottom sediments | Water and BS pollution by TPHs | 05.2008 | 6 (Water), 3 (BS) | YugNIRO |
| 4.14 | 54 | YugNIRO | KS (central&southern part) | Southern Scientific Research Institute of Marine Fisheries and Oceanography (YugNIRO), Kerch | Water, Bottom sediments | Water and BS pollution by TPHs, SH, SS, Fe, Plankton, Benthos | 23.09.2008 | 14 (Water), 14 (BS) | YugNIRO |
| 4.15 | 55 | YugNIRO | KS (central&southern part) | Southern Scientific Research Institute of Marine Fisheries and Oceanography (YugNIRO), Kerch | Water, Bottom sediments | Water and BS pollution by TPHs, SH, Fe | 12.11.2008 | 16 (Water), 5 (BS) | YugNIRO |
| 4.16 | 56 | YugNIRO | KS (southern part) | Southern Scientific Research Institute of Marine Fisheries and Oceanography (YugNIRO), Kerch | Water, Bottom sediments | Water and BS pollution by TPHs, SH, SS | 30.03.2009 | 18 (Water), 7 (BS) | YugNIRO |
| 5.1 | 57* | IBSS | CC, AZ | Institute Biology of the Southern Seas (IBSS), Sevastopol | Water | Ichthyoplankton, ichtyophaunaparasitophauna | 25-27.06.2006 | 8 stations | IBSS NAS UKRAINE, www.ibss.org.ua |
| 5.2 | 58* | IBSS | KS | Institute Biology of the Southern Seas (IBSS), Sevastopol | Water | Parasitophauna of fish | May 2006 | - | IBSS NAS UKRAINE, www.ibss.org.ua |
| 5.3 | 59* | IBSS | CC, AZ | Institute Biology of the Southern Seas (IBSS), Sevastopol | Water | Phyto-, zoo-, ichthyoplankton, ichtyophauna, salinity, water temperature, oxygen | 28.07-01.08.2007 | 8 stations | IBSS NAS UKRAINE, www.ibss.org.ua |
| 5.4 | 60 | IBSS | KS | Institute Biology of the Southern Seas (IBSS), Sevastopol | Water | Ichthyoplankton, ichtyophaunaparasitophauna | 28-29.11.2007 | 8 stations | IBSS NAS UKRAINE, www.ibss.org.ua |
| 5.5 | 61 | IBSS RV Experiment | KS | Institute Biology of the Southern Seas (IBSS), Sevastopol | Water, Bottom sediments | BS pollution by TPHs, bacteriobenthos, macrozoobenthos | 08-12.12.2007 | 26 stations | IBSS NAS UKRAINE, www.ibss.org.ua |
| 5.6 | 62 | IBSS | KS | Institute Biology of the Southern Seas (IBSS), Sevastopol | Water, Bottom sediments | Water & BS chemistry and pollution, Chlorinated hydrocarbons, Mercury, Anthropogenic long–lived radionuclides, phytoplankton, bacterioplankton, virioplankton, picophytoplankton , zooplankton, macrozooplankton, ichthyoplankton, bacteriobenthos, macrozoobenthos | 12-18.12.2007 | 13 stations | IBSS NAS UKRAINE, www.ibss.org.ua |
| 5.7 | 63 | IBSS RV Experiment | KS | Institute Biology of the Southern Seas (IBSS), Sevastopol | Bottom sediments | BS pollution by TPHs, bacteriobenthos,macrozoobenthos | 24.03.2008 | 29 stations | IBSS NAS UKRAINE, www.ibss.org.ua |
| 5.8 | 64 | IBSS | KS | Institute Biology of the Southern Seas (IBSS), Sevastopol | Water | Parasitophauna of fish | May 2008 | - | IBSS NAS UKRAINE, www.ibss.org.ua |
| 5.9 | 65 | IBSS | CC, AZ | Institute Biology of the Southern Seas (IBSS), Sevastopol | Water | Phyto-, zoo-, ichthyoplankton, ichtyophauna, salinity, water temperature, oxygen | 08-15.07.2008 | 8 stations | IBSS NAS UKRAINE, www.ibss.org.ua |
| 5.10 | 66 | IBSS | KS | Institute Biology of the Southern Seas (IBSS), Sevastopol | Water | Heterotrophic and photoautotrophic microplankton, zooplankton | 08-09.2009 | 30 stations | IBSS NAS UKRAINE, www.ibss.org.ua |
| 5.11 | 67 | IBSS, Ministry Emergency Situations | KS, AZ | Institute Biology of the Southern Seas (IBSS), Sevastopol, MES, Kerch | Water | Phytoplankton,BS pollution by TPHs,macrozoobenthos | 26-28.08.2009 | 22 stations | IBSS NAS UKRAINE, www.ibss.org.ua |
| 5.12 | 68 | IBSS | KS | Institute of Biology of the Southern Seas (IBSS), Sevastopol | Water | Bacterioplankton, picophytoplankton, Phyto-, zoo-, ichthyoplankton, | 08-09.2009 | 20 stations | IBSS NAS UKRAINE, www.ibss.org.ua |
| 5.13 | 69 | RV“Naftogas-68” | BS, KS | Institute Biology of the Southern Seas (IBSS), Sevastopol | Water | zooplankton | 25-26.09.2009 | 10 samples | IBSS NAS UKRAINE, www.ibss.org.ua |
| 5.14 | 70 | IBSS | CC, AZ | Institute Biology of the Southern Seas (IBSS), Sevastopol | Water | Phyto-, zoo-, ichthyoplankton, ichtyophauna, parasitophaun | 07-12.08.2010 | 8 stations | IBSS NAS UKRAINE, www.ibss.org.ua |
| 6.1 | 71 | UNEP Expedition | KS, AZ | UNEP | Bottom sediments | Bottom sediments pollution by Petroleum Hydrocarbons | 15-25.07.2008 | 6 samples | UNEP |
Parameters: BS – Bottom Sediments, TPHs – Total Petroleum Hydrocarbons, PHs – Petroleum Hydrocarbons, PAHs – Polycyclic Aromatic Hydrocarbons, ChH – Chlorinated Hydrocarbons (including pesticides and PCBs); TM – Trace Metals, Fe – Iron, S – Sulfur, SS – Suspended Solids, BOD5 – Biochemical Oxygen Demands for 5 days, SH – Standard Hydrochemistry (including Nutrients),
Notes: * - field investigations completed before the accident in November 2007
** - Geographical area: KS - Kerch Strait, BS – Black Sea, AZ – Azov Sea, TP – Taman Peninsula, TI – Tuzla Island, CH – Chushka Spit, DG – Dinsky Bay, TB – Taman Bay, CC - Cazantip Cape.
Inventory of Data sets on the Kerch Strait accidental oil spill, 11 November 2007
Table A3. List of data sets collected in relation with the accidental oil spill in the Kerch Strait on 11 November 2007.
| Project | Area* | Institution | Substrate | Layer | Parameters | Period | Number samples/stations | Format | Owner | |
| 1.1RU | Monitoring of Russian waters | Coastal waters KS, BS, AZ | EHMSC (Cuban Estuarine Station), town Temruk | Water | Surface, Water column | TPHs, Temperature | 13.11.2007 – 03.06.2009 | 617 | MS Excel | SOI, Moscow |
| 1.2RU | Monitoring of Russian part (AbrauDurso-Panagia-Cuban) of the Black and Azov Seas | Coastal waters KS, BS, AZ | Special Center on Hydrometeorology and Environmental Monitoring of the Black and Azov Seas (SCHEM BAS), town Sochi | Water | Surface, Water column | TPHs, Hydrology, Hydrochemistry, Pollution | 28.08.2003 – 15.07.2005 | 79 | MS Excel | SOI, Moscow |
| 1.3RU | Monitoring of Russian part (Abrau Durso-Panagia-Cuban) of the Black and Azov Seas | Coastal waters KS, BS, AZ | Special Center on Hydrometeorology and Environmental Monitoring of the Black and Azov Seas (SCHEM BAS), town Sochi | Bottom sediments | Bottom sediments | TPHs | 06.08.2003 – 16.10.2004 | 8 | MS Excel | SOI, Moscow |
| 2.1RU | Consequences of accidental oil spill | KS, BS, AZ | CherAzTehMorDirektsia, Rosprirodnadzor, MNR, city Novorossiysk | Water, Bottom sediments | Water column, Bottom sediments | TPHs, Hydrochemistry | 24.07.2008-31.08.2008 | 121 | MS Excel | CherAzTehMorDirektsia, Novorossiysk |
| 2.2RU | Consequences of accidental oil spill | KS, BS, AZ | CherAzTehMorDirektsia, Rosprirodnadzor, MNR, city Novorossiysk | Water, Bottom sediments | Water column, Bottom sediments | TPHs, Hydrochemistry | 10.2008 | 163 | MS Excel | CherAzTehMorDirektsia,Novorossiysk |
| 2.3RU | Consequences of accidental oil spill | KS, BS, AZ | CherAzTehMorDirektsia, Rosprirodnadzor, MNR, city Novorossiysk | Water, Bottom sediments | Water column, Bottom sediments | TPHs, Hydrochemistry | 11.2008 | 100 | MS Excel | CherAzTehMorDirektsia,Novorossiysk |
| 3.1UA | Hydrochemical surveys around Tuzla Island | KS, TI | MB UHMI, MHI, Sevastopol | Water | Surface | CTD profiling, SS, pH, Oxygen, Nutrients, Detergents, TPHs | 29.02.2008; 24.04.2008; 11.06.2008; 04.12.2009 | 52 stations | MS Excel | MB UHMI |
| 3.2UA | Hydrological and chemical monitoring of the Kerch Strait on 4 standard stations | KS | Marine Hydromet Station Opasnoe | Water | Water column | Bottle water sampling (T,S, standard chemistry and pollution), currents | 2003-2010, 10-daily or monthly repetition of works on 4 standard stations in the Northern narrowness of the Kerch Strait (with exception of ice presence times) | 4 stations | MS Excell | MB UHMI |
| 4.1UA | Kerch Strait Monitoring- 2002, 2003, 2005, 2007, 2008, 2009, 2010 | KS | Southern Scientific Research Institute of Marine Fisheries and Oceanography (YugNIRO) Kerch | Water, Bottom sediments | Water(surface& nearbottom layer),Bottom sediments | Water and BS pollution by TPHs, SH, TM, SS, Plankton, Benthos | 26.06/29.11.2002, 24.05/22.11.2003, 22.05/14.11.2005, 06.09/18.10/21.11.2007, 07.02/22.04/25.05/23.09/12.11.2008, 30.03/25.06/18.09/.2009, 23.03/25.06/18.09/.2010 | 59/46, 60/16, 55/53, 12/35/18, 43/45/9/42/37, 42/55/42, 42 | MS Excel | YugNIRO |
| 5.1UA | Consequences of accidental oil spill | KS | Institute Biology of the Southern Seas (IBSS), Sevastopol | Bottom sediments | Bottom sediments | BS pollution by TPHs, Bacteriobenthos, Zoobenthos | 08-12.12.2007; 24.03.2008; 26-28.08.2009 | 26; 29; 22 | MS Excel | IBSS |
| 5.2UA | Monitoring of Cazantip Cape | CC, AZ | Institute Biology of the Southern Seas (IBSS), Sevastopol | Water, Bottom sediments | Water(surface& nearbottom layer) | Phyto-, zoo-, ichthyoplankton, ichthyophauna, parazitophauna,hydrochemistry | 25-27.06.2006; 28.07-01.08.2007; 08-15.07.2008; 07-12.08.2010 | 8 stations,5000 samples of fishes | MS Excel | IBSS |
| 5.3UA | Kerch Strait Monitoring- | KS | Institute Biology of the Southern Seas (IBSS), Sevastopol | Water, Bottom sediments | Water(surface& nearbottom layer),Bottom sediments | Bacterio-, phyto-, zoo-, ichthyoplankton | 28-29.11.2007; 12-18.12.2007; 26-28.08.2009; 08-09.2009; 25-26.09. 2009 | 8, 13, 30, 20, 10 | MS Excel | IBSS |
KS* - Kerch Strait, BS – Black Sea, AZ – Azov Sea, TI – Tuzla Island, SS – Suspended Solids, CC - Cazantip Cape
| № | Name of organization and address | Abbreviation | Laboratory | Head of Laboratory | Specialization* | |
| RUSSIA | ||||||
| 1.1 | Special Center on Hydrometeorology and Environmental Monitoring of the Black and Azov Seas of North-Caucasian Regional Division of Roshydromet, Sochi, Sevastopolskaya 25, 354057, Sochi, RUSSIA, www.pogodasochi.ru | SCHEM BAS | Marine Department | Yurenko Yury | bereg@sochi.com | Hydrology, Meteorology, Applied Oceanography |
| 1.2 | SCHEM BAS | Complex Labortatory of Environmental Monitoring (CLEM) | Ljubimtsev Andrey | pogoda@sochi.com | Standard Hydrochemistry, Water Pollution | |
| 2.1 | State Oceanographic Institute of Roshydromet, Kropotkinsky Lane 6, 119034 Moscow, RUSSIA, www.oceanography.ru | SOI | Marine Pollution Monitoring Lab. (LMZ) | Korshenko Alexander | korshenko@mail.ru | Pollution, Monitoring |
| 2.2 | SOI | Modeling of marine water state Lab. | Ovsienko Sergei | s.ovsienko@gmail.com | Oil spills modeling | |
| 2.3 | SOI | Structure of Marine waters and Modeling of currents Lab. | Grigoriev Alexander | agprivat@mail.ru | Modeling of marine waters currents and sea level | |
| 2.4 | SOI | Wind-wave Lab. | Kabatchenko Ilya | wavelab1@yandex.ru | Modeling of wind waves and wind climate | |
| 3 | Estuarine Hydrometeorological Station Cuban’s, Rosa Luxemburg 60, 353500 Temryuk, Krasnodar Region, RUSSIA | EHMSC | Monitoring Pollution of Surface Waters Lab. (LMZPW) | Derbicheva Tamara | temrhimlab@kubanmeteo.ru | Standard Hydrochemistry, Pollutants: TPHs, TM, Detergents, Pesticides, Phenols |
| 4 | Institute of Geography RAS, Moscow, 117019, Staromonetniy Lane, 29 | IG RAS | Ecological Lab. | Fashchuk Dmitry | fashchuk@mail.ru | Marine Ecology, anthropogenic influence consequences |
| 5.1 | P.P. Shirshov Institute of Oceanology RAS, Nakhimovskij prospekt, 36, 117997 Moscow, RUSSIA, www.ocean.ru | SIO RAS | Ecology of the distribution of planktonic organisms Lab. | Flint Mikhail | M_FLINT@ORC.RU | Zooplankton |
| 5.2 | SIO RAS | Ecology of coastal bottom communities Lab. | Kucheruk Nikita | nvkucheruk@mail.ru | Zoobenthos | |
| 5.3 | SIO RAS | Ocean Chemistry Lab. | Peresypkin Valery | peresypkin@ocean.ru | Chemistry, Pollution | |
| 5.4 | SIO RAS | Biochemistry and Hydrochemistry Lab. | Makkaveev Petr | Hydrochemistry | ||
| 5.5 | Southern Branch of Shirshov’s Institute Oceanology RAS, 353467 Gelendzhik, Krasnodar Region, RUSSIA | SB SIO RAS | Chemistry Lab. | Chasovnikov Valery | chasovn@mail.ru | Standard Hydrochemistry, Pollutants: TPHs, Sulphur,TM, Phenols, Detergents, PAHs, Pesticides, PCBs. |
| 6 | Russian Federal Research Institute of Fisheries and Oceanography (VNIRO), V.Krasnoselskay 17, 107140 Moscow, RUSSIA, www.vniro.ru | VNIRO | Marine Ecology Lab. | Sapozhnikov Victor | marecol@vniro.ru | Hydrochemistry |
| 7 | White Sea Biological Station Lomonosov Moscow State University, a/ya 20, Glavpochtamt, Kandalakshsky raion, Murmanskaya oblast, 184042, RUSSIA | WSBS MSU | Benthos Lab. | Tzetlin Alexander | atzetlin@wsbs-msu.ru, atzetlin@gmail.com, atzetlin@mail.ru | Benthos |
| 8 | Scientific and Industrial Unit “Typhoon”, Pobeda prospect 4, Obninsk, Kaluga region, RUSSIA | Typhoon | Center of Environmental Chemistry | Kochetkov Alexander | akochet@mail.ru | Analytical chemistry |
| UKRAINE | ||||||
| 1.1 | Marine Branch of Ukrainian Hydrometeorological Institute, Sovietskaya street 61, 99011 Sevastopol, UKRAINE, www.uhmi.org.ua/sub/sevastopol/ | MB UHMI | Laboratory of coastal zone and river mouths | Ilyin Yuriy | mb_uhmi@stel.sebastopol.ua | Azov and Black Sea coastal oceanography, marine meteorology, riverine inputs, estuarine hydrology |
| 1.2 | MB UHMI | Laboratory of marine chemistry | Riabinin Anatoliy | mb_uhmi@stel.sebastopol.ua | Standard hydrochemistry, pollutants: TPHs, chemical properties of atmospheric precipitations and aerosols | |
| 1.3 | MB UHMI | Laboratory of marine hydro-meteorology | Fomin Volodymyr | fomin@vip.sevsky.net | Azov and Black seas oceanography and marine meteorology, numerical modeling of dynamical processes | |
| 2.1 | Marine Hydrophysical Institute of National Academy of Science of Ukraine. Kapitanskaya street 2, 99011 Sevastopol, UKRAINE, www.mhi.iuf.net | MHI | Department of shelf hydrophysics | Ivanov Vitaliy | vaivanov@alpha.mhi.iuf.net | Shelf and coastal zone hydrophysics |
| 2.2 | MHI | Department of marine bio-geo-chemistry | Konovalov Sergey | sergey@alpha.mhi.iuf.net | Marine chemistry and ecology | |
| 3 | Institute of Geological Sciences of National Academy of Science of Ukraine, O.Gonchara street 55-b, 01054 Kiev, UKRAINE, www.igs-nas.org.ua | IGS | Gozhik Petro | info@igs-nas.com.ua | General and marine geology | |
| 4 | Ukrainian Scientific Center of Ecology of the Sea, Ministry of the Environment Protection, Odessa, French blvd., 89 | UkrSCES | Department of Analytical Research | Denga Yuriy | lawmd@te.net.ua | Standard Hydrochemistry, Particle size analysis, Pollutants: TPHs, PAHs, Pesticides, PCBs etc. |
| 5 | Marine Hydrometeorological Station “Opasnoye”, Turgeneva street 5, Zhukovka settlement, 98307 Kerch, Crimea, UKRAINE | MHS Opasnoye | no | Golovnenko Svitlana | no | Marine meteorology and hydrology, regional monitoring of the Kerch Strait water quality |
| 6.1 | Southern Scientific Research Institute of Marine Fisheries and Oceanography; Sverdlov Street 2, 98300 Kerch, AR Crimea UKRAINE, www.yugniro.crimea.com | YugNIRO | Marine Ecosystem Protection Lab. (MEPL) | Petrenko Oleg | yugniro@kerch.com.ua | Standard Hydrochemistry, Pollutants: Trace Metals, TPHs, Chlororganics, Environmental Impacts, Zooplankton |
| 6.2 | YugNIRO | Distant Monitoring Sector | Borovskaya Raisa | yugniro@kerch.com.ua | Remote sensing, Satellite images interpretation, forecasting | |
| 6.3 | YugNIRO | Non-fishes Resources Sector | Litvinenko Nataly | yugniro@kerch.com.ua | Zooplankton, Benthos | |
| 7.1 | Institute of Biology of the Southern Seas of NASU, Nakhimova av. 2, 99011 Sevastopol, UKRAINE, www.ibss.org.ua | IBSS | Department of plankton | Boltachev Alexander | a_boltachev@mail.ru | Bacterioplankton, phytoplankton, zooplankton, ichthyoplankton, ichthyofauna, biodiversity, marine ecology |
| 7.2 | IBSS | Department of marine sanitary hydrobiology | Mironov Oleg | msh@ibss.iuf.net | Marine ecology, Oil pollution, bacteriology, benthos | |
| 7.3 | IBSS | Ecological parasitology Department | Gaevskaya Albina | a.gaevskaya@ibss.org.ua | Ecological parasitology | |
| 7.4 | IBSS | Laboratory of Radiation and Chemical Biology | Stokozov Nikolai | stokozov@mail.ru | Marine radioecology and biogeochemistry | |
Measures taken by the Russian Federation
5.1. List of ships taking part in the operations after the storm on 11 November 2007
· KIL-25 specialized vessel belonging to the Russian Black Sea Fleet;
· GS-700 vessel of the Russian Black Sea Fleet;
· Velboat-668 vessel belonging to the Russian Federal Security Service Frontier Guards;
· Volgoneft-250 tanker for oil products pumping of the BashVolgoTanker public company;
· Volgoneft-119 m/v of the BashVolgoTanker;
· Volgoneft-249 m/v of the BashVolgoTanker;
· Lenaneft-199 m/v of the BashVolgoTanker;
· PK-18/35 self-propelled floating crane;
· SLV-05 for collecting oil products of the Rosmorport federal unitary enterprise;
· Captain Zadorozhny sea-going tug of the Rosmorport;
· Mercury sea-going tug of the Rosmorport;
· Vostok pilot cutter of the Rosmorport;
· Berkut pilot cutter of the Rosmorport;
· Potyomkinets Gasanenko pilot cutter of the Rosmorport;
· Sportis-2468 high-speed boat of the Russian Ministry of Emergencies;
· Valery Zamaraev cutter of Russian Ministry of Emergencies;
· BM-627 boat of Russian Ministry of Emergencies;
· Sportis high-speed boat of the Novorossiysk DSRUTO;
· Vodolaz-2 roadstead diver cutter of the Novorossiysk DSRUTO;
· Lamor skimming vessel for collecting oil products of the Novorossiysk DSRUTO;
· Tornado sea-going tug of the Novorossiysk DSRUTO;
· Svetlomor-3 sea-going salvage tug of the Novorossiysk DSRUTO;
· Svetlomor-4 sea-going Ukrainian salvage tug;
· Protei sea-going tug of the Anship Ltd;
· MB-173 vessel;
· Neptunia sea-going tug;
· I. Krasnoselsky sea-going tug;
· Irakl Ukrainian sea-going tug;
· LK-57 Ukrainian pilot cutter;
· Odonis Ukrainian sea-going tug;
· Mekhanik Krasotkin Ukrainian sea-going tug;
· Val sea-going tug of the Donrechflot public company;
· Enikale sea-going tug belonging to the EvroTEK Universal Ltd.;
· Mekhanik Razhev m/v;
· Bora Ukrainian sea-going tug;
· Impulse emergency response vessel.
5.2. Measures for emergency situation tackling and environment monitoring realizing:
In respect to the Volgoneft-139 m/v (stern part):
· the Volgoneft-139 m/v stern part was moored within the area of the Caucasus (Kavkaz) port berth No24 branch section. Two BPP-1100 booms (150 m and 170 m) were deployed;
· on 16 November 2007 a verification report was received specifying that 8,861 tons of heavy fuel oil were pumped from the Volgoneft-139 m/v tanks No7 and No8 to the Volgoneft-119 m/v.
· the operations of cleaning the heavy fuel oil spill-over produced by the Volgoneft-139 m/v stern section were carried out and completed by personnel and technical facilities of the Novorossiysk Department for Safe and Rescue Measures, And Boat Lifting Underwater Technical Operations (DSRUTO). Oily water was collected at location of the boat tanks No7 and No8. Approximately, 50 m3 of heavy fuel oil and 120 m3 of oily water were collected there.
In respect to the Volgoneft-139 m/v (bow part):
· the Svetlomor-3 salvage tug collected discharged oil products within the spill area on 15-17 November 2007. Approximately 43 tons of oily mixture and 1,200 kg of heavy fuel oil (in barrels on board) were collected;
· on 17 November 2007, divers of the Vodolaz-2 roadstead diver cutter from the Novorossiysk DSRUTO inspected the Volgoneft-139 m/v bow part in order to determine its feasibility of recovery;
· on 23 July-14 August 2008, an operation to lift the Volgoneft-139 m/v bow part was conducted in the Kerch Strait water area.
The operations to lift the Volgoneft-139 m/v bow part in the Kerch Strait water area were carried out by personnel and technical facilities of the Novorossiysk DSRUTO, the State Marine Pollution Control, Save and Rescue Administration Russian federal enterprise, SMPCSA and the Black Sea Fleet.
5.3. Chronology of first measures was taken:
14 November 2007, in order to prevent the oil products spread to the Dinsky and Taman Bays, two booms, i.e., Super Max-1100, 200 m and BPP-830, 200 m, were installed on the strait between the Tuzla Spit and the Tuzla Island;
· 17 November 2007, divers of the BM-627 boat inspected the Nakhichevan m/v. No missing persons were found;
· 15-19 November 2007, the Vostok pilot cutter was engaged with collecting the leaked oil products at location of the Volgoneft-139 m/v bow part; 4,500 kg of sorbent agent were used;
· 17 November 2007, the Russian Svetlomor-3 and Ukrainian LB-57 salvage tugs guided by the Kerch VTS –vessel traffic system were engaged with collecting the leaked oil products in the Kerch Strait water area;
· During the 17-22 November 2007 period, 930 kg of the SorbOil sorbent agent were used for additional clean-up at the BN-139 location;
· 20 November 2007, the Sportis-2468 cutter undertook examinations of the water area in the vicinity of berth No24, and cutter Sportis examined the shore line and water area near Tuzla Spit;
· 21 November 2007, the Sportis cutter and the Captain Zadorozhny tug having ecologists on board collected water samples on the Kerch Strait; the Svetlomor-3 was engaged with collecting the spilled over oil products in the Kerch Strait southern part; the Vodolaz-2 diver cutter jointly with the Lamor supply vessel completed the Volgoneft-139 m/v bow part diving inspection in order to arrange for its lifting;
· 22 November 2007, the BM-627 vessel and Sportis cutter made a diving inspection of the Volnogorsk m/v; the Vodolaz-2 diver cutter jointly with the Lamor technical supply vessel undertook a diving inspection at location of the Volgoneft-139 m/v bow part;
· 23 November 2007, the Vodolaz-2, BM-627 and Sportis cutter inspected through diving the Volgoneft-139 m/v bow part, and the Volnogorsk and Nakhichevan vessels. The KIL-25 and MB-173 boats were engaged with preparing pontoons and equipment necessary for the vessel lifting operations.
The Kerch Strait water area emergency was tackled by personnel and facilities of the Novorossiysk DSRUTO, the Taman port authorities, the Taman branch of the Rosmorport (the Russian sea ports) federal unitary enterprise, and the Black Sea Fleet.
5.4. Measures of emergency situation headquarters
In order to eliminate the accident consequences, the emergency situation headquarters took the following measures:
1. The stern section of the Volgoneft-139 m/v was recovered and towed to Caucasus port.
2. Pumping operations of 886.253 tons of heavy fuel oil from the stern part of Volgoneft-139 (tanks No7 and No8) to the Volgoneft-119 were completed. On 4 December 2007, in total 1,094 tons of the heavy fuel oil was released from the Volgoneft-139 m/v stern part.
3. Through the efforts of the Novorossiysk DSRUTO personnel and facilities, operations were carried out to tackle the spilled over heavy fuel oil at the location of the Volgoneft-139 m/v bow part. In total, 43 tons of oily mixture and 1,200 kg of heavy fuel oil were collected.
4. The Volgoneft-139 m/v, Nakhichevan m/v and Volnogorsk m/v bow parts were inspected by means of diving. Expenditures related to refloating operations were calculated. No heavy fuel oil at the bottom was detected.
5. On 9-10 December 2007, from the Volgoneft-139 bow part heavy fuel oil left was pumped out from tanks No1 and No2 onto the Mekhanik Razhev m/v (1,020 m3 of oily water).
6. The port authorities specialists from the Taman Port Federal Institute jointly with representatives from Rosprirodnadzor (the Russian Federal Natural Resource Supervisory Management Service) and the Ministry of the Russian Federation for Civil Defense, Emergency Situations and Natural Disasters Response (EMERCOM), the Temruk area administration conducted environment conditions monitoring through collecting water samples at the Volgoneft-139 bow part and locations of the other remaining parts.
7. At the Caucasus port, conditions of the water area in the vicinity of the Volgoneft-139 stern section location were monitored. A boom was installed around the inspected area and the oil products surfacing slicks were collected.
8. The personnel and facilities (the VTS, pilots and ships crossing the area) of the port authorities of the Taman Port Federal Institute and the Taman branch of the Rosmorport federal unitary enterprise were engaged with visual monitoring over the water area conditions in the southern part of the Kerch Strait at location of the Volgoneft-139 m/v bow part and other sunken vessels.
9. The Russian EMERCOM personnel jointly with the people living in the accident vicinity collected 47,000 tons of oil-contaminated substrate and seaweeds, and cleaned up nearly 46 km of the coastline.
10. From 15 February through the end of 2008, the Russian EMERCOM personnel (the KubanSpas branch, 82 persons) was engaged with cleaning the coastline from the oil-contaminated seaweeds around the Tuzla Spit, Kuchugury settlement, and in the southern part of the Chushka Spit.
11. Since 20 June 2008, the Novorossiysk DSRUTO personnel installed a boom in the southern part of the Kerch Strait to block-off the Volgoneft-139 bow part before and during lifting. Monitoring was performed over the water surface ecological conditions, while the sorbent agents were used and spilled over oil products collected and loaded aboard the Impulse emergency response vessel.
12. On 14 August 2008, the Volgoneft-139 bow section was lifted. It was towed to berth No25 at the Caucasus port. Later on, it was disassembled, cut into pieces and scrapped.
13. In total, 1,098 tons of bunker oil was collected from the Volgoneft-139 bow part.
5.5. Personnel and facilities engaged with the Kerch Strait emergency response on 11 November 2007
To rescue people at the time of catastrophe: Neptunia, I. Krasnoselsky, LK-57, Captain Zadorozhny, Mercury and Irakl.
To refloat the Dika and Dimetra barges: Odonis, Mekhanik Krasotkin and Val.
To discharge the oily water and tow the Volgoneft-139 m/v stern part: Volgoneft-119, Mercury, Captain Zadorozhny and Sportis.
In search for people: Velboat-668, LK-57, Enikale, Berkut, GS-700, Valery Zamaraev and Mi-8 Helicopter of the Russian Ministry of Emergencies.
For pumping out heavy fuel oil from the Volgoneft-123 m/v at the Caucasus port: Volgoneft-249.
Oil spill clean-up operations: collecting oily water, treating the Kerch Strait water area with sorbent agent and in collecting the water samples: SLV-05, Lamor, Svetlomor-3, Svetlomor-4, Vostok, Potyomkinets Gasanenko, Captain Zadorozhny, Sportis and 1,500 m of booms, and 5 tons of sorbent agent.
For lifting the Volgoneft-139 m/v bow part and in transshipping the heavy oil fuel: KIL-25, Volgoneft-250, PK-18/35, Vodolaz-2, SLV-05, Lamor, Svetlomor-3, Svetlomor-4, Captain Zadorozhny, Mercury, Protei, Tornado, MB-173, Vostok, Berkut, Potyomkinets Gasanenko and SSP-200, and SSP-80 pontoons, two sets each, belonging to the Novorossiysk DSRUTO and the divers, 14 persons from the Novorossiysk DSRUTO and Russian EMERCOM.
For discharging heavy fuel oil at the Novorossiysk port and taking in the oily water: Lenaneft-199 and Volgoneft-249.
Employed in total, the first and second priority level facilities and means accounted for 33 vessels, 1,500 m booms, two oil-filtering nets, four skimmers and two oil pumping systems, as well as 500 persons.
The Russian Federation Government as a party to the joint Russian-Ukrainian working group on rectification of the catastrophe consequences issued Decree No1606-p on 14 November 2007 to recognize the oil products spill-over and the necessity for pollution prevention in the Kerch Strait water area and by its shores. The Russian Federation Deputy Minister of Transport B.Korol was appointed to chair the Russian party to the working group.
In compliance with paragraph 1 of report on the Meeting No VZ-P9-25pr held on 13 November 2007 and chaired by the Russian Federation Government Chairman V.Zubkov, and following up on Decree No163 issued on 15 November 2007 by the Russian Ministry of Transport, in order to rectify the Kerch Strait catastrophe consequences and determine the ship accidents causes, an Interdepartmental Commission was established, hereinafter referred to as the Commission. Commission’s activity became governed by the Regulations on Commission approved by the Russian Minister of Transport and Chairman of the Commission I.Levitin on 13 December 2007 (No K-18/30424). The work carried out by the commission on rectification of the Kerch catastrophe consequences is described further on.
By Decree No AD-141-p dated 12 November 2007 and issued by the Rosmorrechflot federal agency of maritime and river transportation, an emergency response center was established to manage the Kerch accident consequences rectification. On the SMPCSA basis, a Rosmorrechflot immediate response group was organized to be a part of the established center.
The Novorossiysk Rescue in Accident and Underwater Engineering Center, a federal state unitary enterprise, FSUE was nominated the principal agency for rectifying the accident at sea consequences. The established center carried its work in cooperation with personnel and facilities of Russia’s EMERCOM, Ministry of Defense and the Rosmorport FSUE.
In compliance with the Krasnodar Territory administration’s Decision No 592 dated 12 November 2007 on the emergency response committee, certain personnel and facilities were urgently organized into a group in order to start rectifying the catastrophe consequences within the Krasnodar Territory. The following agencies were included into the group:
· • Joint Emergency Rescue Center to incorporate representatives with executive authority from the Krasnodar Territory and federal executive institutions;
· • EMERCOM personnel and facilities;
· •the Krasnodar Territory fire department units;
· • Kuban-SPAS rescue teams, the Krasnodar Territory emergency response public service;
· • units of the Krasnodaravtodor public agency of the Krasnodar Territory;
· •municipal squad units of the EMERCOM territorial subdivision in the Krasnodar Territory, from the Novorossiysk, Temruk, Crimea and Slavyansk regions in particular.
·
· Representatives of public and environmental organizations took an active part in rectification of the catastrophe consequences, and among them were:
· • joint student teams from Krasnodar, and the Gelendzhik and Anapa resort cities;
· •cadets from the Novorossiysk Maritime Academy;
· •a joint youth team from Armavir;
· •volunteer and professional ornithologists from the hunting and fishing societies.
450 persons of military personnel were engaged with oily products removal from the shore.
For rectification of the catastrophe consequences human and technical resources engaged were to total of 2,500 persons and 300 units of equipment.
Due to the necessary use of professional means and facilities while collecting and disposing oil products in highly polluted and poorly accessible areas, it was arranged to involve personnel and facilities from the Emergency Response and Ecological Center, ECOSPAS under the Russian EMERCOM to total 45 persons and 7 units of special equipment. They carried out the most difficult part of the work, i.e., operations for cleaning the seaweeds polluted by heavy fuel oil and removing oil products from the shore. The Tuzla Spit polluted bottom areas were treated with sorbent, while the sorption mass was pumped out and removed to its temporary storage place.
Storage of soil and seaweeds polluted with oil products was arranged at the specially equipped sites belonging to the Sirius closed joint stock society, the Azov-Black Sea experimental research and production enterprise, and in the target area by the Gorelaya mountain root in the Temruk region.
For accommodation of personnel engaged with rectification of the catastrophe consequences, temporary premises were arranged close to the coast cleaning area, where the railway cars were prepared as living quarters and catering, medical assistance and recreation were furnished.
For cleaning the coast polluted with oil products, the Krasnodar Territory administration established a reserve, and out of it 1,200 sets of entrenching tools, 700 sets of protective garments for oil products collection and 20,000 polypropylene bags were distributed among the workers.
By now, the main coast cleaning works at the Tuzla and Chushka spits have been completed. The works were carried out to clean from secondary pollution specific coastal areas, as well as poorly accessible, waterlogged and flooded places requiring attendance of specialized units (the Ahilleon Cape and the Panagia Cape). Cleaning of the poorly accessible, waterlogged and flooded places in the Tuzla Spit southern end was jointly done by the Southern Regional Emergency Response and Ecological Center and the ECOSPAS teams totaling 46 persons, six units of equipment with participation of the Kuban-SPAS, the Krasnodar Territory Emergency Response Service totaling 60 persons and one unit of equipment.
As a result of the works performed in January 2008, the shoreline four km at five isles by the Chushka Spit and seven km at the Panagia Cape fishing port at the Tuzla Spit were cleaned. At the Tuzla Spit, were cleaned 1,200 m of its shoreline. The sorbent booms were installed to protect the shoreline of the five cleaned isles. In total, 3,775 sacks of oil-contaminated wastes were collected (2,100 sacks near the Ilyich settlement and 1,675 sacks on the shore) and taken to the Gorelaya mountain temporary landfill.
The Russian EMERCOM constantly searched for the lost seamen through employing rescue boats and while carrying out recovery operations, as well as through patrolling the shoreline and flying helicopters over the shore. For this, four helicopters were provided by the EMERCOM.
Sorption agents were used to absorb oil slick on the water surface in order to further collect it. To carry out the shoreline and water area clean-up operations, six tons of sorbent were used, while two tons of sorbent were delivered to the Ukrainian party in the course of the rescue and recovery operations. The Kerch Strait shoreline was inspected in search for people and to determine the polluted areas and focus on the areas prone to disrupt the ecological balance.
To arrange the works in the difficult to access areas, special equipment, professionally trained personnel and the ECOSPAS equipment, i.e., 45 persons and 7 pieces of technical means and special equipment were sent to the emergency area.
In order to decrease the oily sludge transporting distance to its place of storage and treatment, construction of a temporary crossing and flow-through dam was initiated. Subunits of the Southern region search-and-rescue team and an emergency response team from the Rescue in Accident and Underwater Engineering Center administration under the Russian EMERCOM conducted the offshore diving operations, while 35 EMERCOM divers were engaged. The following EMERCOM floating crafts were used in the course of the diving operations: the Valery Zamaraev, Vodolaz-2, Sportis and KS-700 boats and vessels.
During the whole search and rescue period, and in the course of the rescue and recovery operations, the Rosselkhoznadzor specialists, the hunters and fishermen societies members kept collecting and recording the number, and scavenge of the birds killed by oil pollution. The perished birds were taken to the Beregovoy settlement area, while in total 5,487 dead birds were collected and scavenged. Wherever the birds alive were found, they were washed and treated for rehabilitation at the Temrukchanka recreation center. A total of 244 birds were saved alive, 91 birds died during their rehabilitation treatment, and 111 birds were fully rehabilitated and set free, while 42 birds were transferred to the Russian Caucasus regional office of the World Wildlife Fund. In 2008, a general shoreline clean-up operation was carried out in the framework of preparation for the holiday season to liquidate the spring warming possible discharges.
In order to carry out the search and rescue operations, and rectify the Kerch Strait accident consequences, the Black-Azov seas border administration units of the Russian Federation Federal Security Service Coast Guards jointly with the Russian Federation Federal Security Service aviation were engaged in line with the Federal Executive Authorities Interaction Plan adopted by the Russian Federation Government Decree No 834 dated 26 August 1995. In their course, 57 hours were spent in the air, and the ships covered more than 600 miles during 70 navigation hours.
Russia has submitted all the necessary documents to the IOPC Fund in accordance with established procedures. Its claim is under the on-going consideration.
| Party involved | Extent of damage, rubles | Category | Fund percentage, per cent | Amount of compensation sought from the liability limitation fund |
| Novorossiysk Department for Safe and Rescue Measures, And Boat Lifting Underwater Technical Operations, the Novorossiysk DSRUTO | 73,450,452 | Clean-up of the sea area, stern towing and oil pumping out from the bow. | 31.9 | 37,207,107 |
| Federal Supervisory Natural Resource Management Service | 6,048,000,000 | Damage caused to the environment and assessed through using the methodologies. Note: Documents submitted cover the expenses of up to 300,000 rubles. | ||
| Krasnodar Regional Department for Emergency Situations and Federal Ecological Control | 134,943,430 | Shoreline clean-up. | 58.60 | 68,349,106 |
| Kerch Commercial Seaport, public enterprise | 15,871,575 | Accident response. | 6.89 | 8,036,269 |
| BashVolgoTanker, closed joint stock company | around5,000,000 | Storage and waste utilization. | 2.17 | 2,531,016 |
| Fund for Social and Economic Development of the Temruk region | around1,000,000 | 0.44 | 513,201 |
The Russian Federation Federal Hydrometeorology and Environment Monitoring Services ensured hydro-meteorological support for the search and rescue, and recovery operations within the Kerch Strait water area and in the Black and Azov seas adjacent areas.
Rosprirodnadzor (the Federal Supervisory Natural Resource Management Service) carried out the following works:
• Integrated inspections of polluted shore with subsequent reporting in writing; the polluted area was determined.
· Visual inspection of the Kerch Strait water area in the zone of boat pollution.
· Aircraft monitoring of pollution zone and mapping of its coordinates.
· Composition of pollution propagation working map on a daily basis based on the air reconnaissance data.
· Ecological monitoring over the sea operations for the sunken ship recovery and transportation.
· In cooperation with a specialized laboratory of the FSI Laboratorial Test and Measurement Center of the Southern Federal District, the sea water and bottom sediments in the polluted area were sampled jointly with taking samples from the shore soil in the amounts sufficient to determine the mass of pollutants to have affected the environment in the accident. In total, 1,000 samples were collected.
· In cooperation with a specialized laboratory of the Federal Agency for Water Resources Kuban Basin Water Administration, the sea water conditions were continuously monitored in selected areas till the complete self-recovery of marine environment became apparent.
· Damage caused to all ecospheres in the accident result was estimated.
· Proposals were made about the site for temporary storage of the soil and algae contaminated with heavy fuel oil and their processing.
· Monitoring was performed over the shore areas exposed to the primary treatment and the soil analytical check-up sampling was carried out in order to detect the oil product residuals therein.
· For the ecological situation improvement, recommendations to carry out a long-term exercise were developed and presented to the Ukrainian side which further summarized them in cooperation with Rosprirodnadzor jointly with the information constantly obtained by the Russian laboratories and other services about the Kerch Strait ecological situation and exchanged with the Environmental Services of Ukraine on a daily basis.
· Scenarios were developed to organize a Bird Hospital in a Zaporozhie rural settlement.
· Proposals were made to include several top-priority exercises into the regional goal-oriented program targeting the Kerch Strait emergency area bio-resources recovery within the Azov and Black seas water area.
V. Main conclusions, certain legal deficiencies and lessons learnt
During the last 50 years, the waves of two meter maximum height were observed nine times only in the Kerch Strait northern part, i.e., six times in April, two times in June and once in July, and under the northern direction winds exclusively. Ships anchored at the berths in the Kerch Strait southern part were protected from the northern direction winds by the Tuzla Spit. The southern direction winds frequency could reach 12% in the sea north-eastern part, while previously their speed had never exceeded 15-17 m/sec.
Throughout the period of instrumental observations starting from 1936, waves of two meter height and, moreover, of four meters height were registered under stormy wind conditions similar to those observed during the Kerch accident. All the year round except for March, waves of 0.7 - 1 m height and less prevailed on the strait. According to conclusions drawn by the Russian Meteorological Office laboratory for real-time marine forecasts, "the cyclone to have caused an abnormally strong storm on the Kerch Strait on 11 November 2007 was produced by a cold atmospheric front that had approached the Black Sea from the north-west on 10 November 2007. During a very short period of time (a day), an active cyclonic whirl got formed out of an atmospheric wave and triggered by the cold front arrived to the Black Sea basin in the vicinity of the Crimea Peninsula. Later on, during 11 November, it passed by the Crimea and the Azov Sea, reached the Black Sea shore and exhausted itself on 13 November. Such an ‘explosive’ cyclone character could be attributed to the following factors: Huge air temperature contrasts observed in the cold front area (9-15 degrees), the Black Sea warm water area and a cold area advection from above in the free atmosphere, that caused a ‘surge’ of night convection, produced huge storm and thunder clouds jointly with the wind gusts. With regard to the Kerch Strait (from the south to the north), the wind-generated waves overlapped the ripples from the south, while the wind started blowing first from the east and then changed direction to the southern and south-western, which produced synchronous resonant waves... Thus, two dangerous phenomena emerged simultaneously: A high storm wave and a strong equally increasing wind".
Numerical modeling of the wave situation to occur on 10-12 November 2007 at the Black Sea has shown that on 11 November the wind direction was the most wave-dangerous (from the south-west) while its speed was reaching up to 25 m/s (with gusts of up to 34 m/s). This phenomenon produced the waves of up to 12 m high in the open sea and of up to 4-8 m high on the Kerch Strait. For the river-sea navigation vessels designed to withstand the maximum permissible wave height of 2-2.5 m, those waves were extremely dangerous due to exceeding the boats such technical capacities as their hull strength, floatability and independent movement capability.
Also, by 11 November, about 120 vessels had gathered for unloading and were anchored at the berths in the Kerch Strait southern part. Ships were normally anchored at the berths of the Kerch Strait transshipment complex by instruction of the traffic superintendents from the Maritime Traffic Regulation Centre of the Kerch port (Ukraine). Sometime before, the Kerch Strait transshipment complex had been supervised by the Port Captain of the Caucasus port (Russia), after 2006 the complex was moved closer to the Ukrainian shore and its supervision was transferred to the Port Captain of the Kerch port (Ukraine). By this, the Russian side lost the ability to affect compliance with the safety standards at the complex.
Ukrainian transshipment complexes organizing within the area difficult for navigation (shallow waters, absence of natural shelters for protection from the storms) and their further operating suffered substantial deficiencies produced by the lack of adequate operational offices and facilities available and competent to engage with the search and rescue effort, and ensure required preparedness for the oil product spill liquidation.
Due to the lack of adequately arranged regulation of traffic supervision and control produced by the Maritime Traffic Regulation Centre administration, lines of ships stood waiting for transshipment at the berths (the Tver fuel supply tanker, berth No 471). For the transshipment complex area, the southern direction winds were wave-dangerous. The 11 November 2007 storm was accompanied by the southern direction wind specifically, while the gusts speed was reaching up to 34 m/s, which combined with the shallow waters at the vessels anchorage berths increased formation of the so-called destructive waves of up to 6-7 m high in front of the Tuzla Spit. As a result of this natural calamity, four human lives and four vessels were lost, and four persons went missing.
The Volgoneft-139 tanker broke apart that resulted in the marine environment pollution: More than 2,000 tons of heavy fuel oil were spilled over into the sea. Also, about 6,500 tons of sulfur were washed off into the sea from other vessels that sunk. The total area of polluted sea surface in the Black and Azov seas basin accounted for 664 km2, and nearly 183 km of coastline got contaminated with oil products.
The Russian dry cargo boats of Nakhichevan loaded with 2,366 t of sulfur, Volnogorsk , loaded with 2,437 t of sulfur and Kovel, loaded with 1,923 t of sulfur got sunk. Besides some vessels sinking or going lost, the Vera Voloshina dry cargo boat, pr 1557 (flying the flag of Ukraine) got washed ashore at the Cape Meganom in the Black Sea during the Kerch Strait storm on 11 November 2007. After stranding, the ship’s hull broke into two and luckily its crew members were not hurt. In the vicinity of the Sevastopol port, the Hash Ismail sea-going dry cargo boat (flag of Georgia, the Syrian crew) perished and 15 persons went missing. Near the Novorossiysk port, the Ziya Koc (flag of Turkey, the Turkish crew) sea-going dry cargo vessel was washed ashore.
In the result of search and rescue operation carried out on 11-13 November on the Kerch Strait, 37 people were saved, the bodies of four persons were found and four persons were reported missing (the Nakhichevan m/v crew members). On 13 November 2007, heavy fuel oil was transshipped from the Volgoneft-123 damaged tanker to the Volgoneft-249 tanker (berth No 6 at the port of Caucasus). The total mass of heavy fuel oil pumped from one vessel to another amounted to 4,146 tons.
On 15 November 2007, the Volgoneft-139 stern was brought afloat and towed to the port of Caucasus. On 14 August 2008, recovery of the Volgoneft-139 bow was completed and it was towed to berth No25 at the port of Caucasus, where it is currently being dismantled to be recycled afterwards.
The total mass of heavy fuel oil and substrate mixed with heavy fuel oil was as follows:
· 1,098 tons of heavy fuel oil was released from the Volgoneft-139 tanker stern;
· about 50 m3 of heavy fuel oil and 200 m3 of oily mixture were gathered by the Novorossiysk DSRUTO from the water area on the way of the Volgoneft-139 stern;
· 110 tons of heavy fuel were gathered from the water area by the Svetlomor-3 salvage tug;
· the heavy fuel oil spilled on the way of the Volgoneft-139 m/v bow was removed by the Novorossiysk DSRUTO and 43 tons of oily mixture and 1,200 kg of heavy fuel oil were collected;
· on 9-10 December 2007, the Volgoneft-139 bow was recovered and heavy fuel oil was pumped out from the Mechanik Razhev tanks No1 and No2 totaling 1,020 m3 of oily mixture;
· 47,000 tons of substrate mixed with heavy fuel oil and seaweeds were gathered and about 46 km of the shore were cleaned up by the emergency situations ministry and the population.
About 5,487 dead birds were gathered and scavenged. Wherever the birds alive were found, they were bathed and rehabilitated at the Temriuchanka recreation centre. In total, 244 birds alive were collected, though 91 of them died during the rehabilitation, while 111 were successfully rehabilitated and set free and 42 birds were transferred to the Russian Caucasus regional branch of the World Wildlife Fund.
To order to rectify the emergency situation consequences, manpower and technical resources used ashore accounted for 2,500 persons and 300 units of equipment. In total, the sea-based resources employed to rectify the Kerch Strait catastrophe consequences stood as 12 vessels, 3,000 m of booms, two oil-gathering trawls, four skimming devices and two oil-pumping systems. The total number of employed personnel was more than 500 persons.
Measures taken by Ukraine
Tarasova Oksana, Bon Alexander
6.1. General overview of activities in the extraordinary situation
As soon as the competent authorities were informed about the incident in the Kerch Strait the salvage and rescue operation as prescribed by the national system of Ukraine was started. The Operational Commission presided by the representatives of the Ministry of Transport of Ukraine was immediately set up and consisted of the representatives of the Ministry of Transport, Ministry of Emergencies, Ministry of the Environmental Protection, Ministry of Health and other concerned agencies. The main task of the initial phase of the incident was to save lives and to stop leakage of the heavy oil.
From the very beginning of the incidents in the Kerch Strait the Ministry of the Environmental Protection of Ukraine directed its efforts mainly at:
· Assessments of the impact of the extraordinary incidents on the marine environment;
· Daily monitoring observations of the levels of pollutants in the marine waters in the areas of the incidents of the vessels of the Russian Federation (near the island Tuzla and the coastline of the Kerch Strait) from the Cape Takil at the south of the Kerch Strait to the Cazantip Cape in the Sea of Azov around the Kerch Peninsula;
· Satellite monitoring of the pollution (analysis and interpretation of the satellite images);
· Operative information for the Cabinet of the Ministers of Ukraine about the state of the environment in the impacted area, observed changes and implemented measures for minimization of the impact of the incidents on the marine environment and the coastal line;
· Coordination of the efforts of the subordinated territorial and specialized agencies that in cooperation with representatives of the other competent authorities and general public directly worked in the impacted area.
·
The scientific and technical measures for elimination of the consequences of the extraordinary situation included:
· Involvement of the leading scientific institutions – Marine Hydrophysical Institute (MHI, Sevastopol), Southern Scientific and Research Institute of Fisheries and Oceanography (YugNIRO, Kerch), Kovalevsky Institute of the Biology of the Southern Seas (IBSS, Sevastopol).
· Modeling of the extraordinary situation and forecast of the possible effects as in whole for the Black Sea environment and for the separate components of the marine ecosystems.
· Preparation and Implementation of «The Research Program for the Assessment of the Consequences of the Pollution of the Marine Ecosystem resulted from the Kerch Incident on 11.11.2007. Development of Recommendations for Mitigation of the Negative Consequences».
6.2. Operational Monitoring Observations
Operational monitoring observations of the state of the marine environment in the Kerch Strait and adjacent marine areas, including the areas of vessel incidents, Tuzla Island, and the coastal waters from the Cape Takil (in the southern part of the Kerch Strait) till Cazantip Cape (the Sea of Azov), around the Kerch Peninsula has been started immediately after the incidents and carried out by the specialized bodies of the Ministry of the Environmental Protection – State Environmental Inspection of the Sea of Azov, State Azov-Black Sea Environmental Inspection and the State Environmental Inspection of the North-Western Part of the Black Sea. The data obtained from the operational monitoring after the necessary analyses were made public daily at the website of the Ministry of the Environmental Protection.
6.3. The field studies of the state of the marine environment in the area of the Kerch Strait and adjacent areas of the Black and Azov Seas
The Ministry of the Environmental Protection of Ukraine developed and approved the Program of Integrated Environmental Monitoring of the Kerch Strait and adjacent areas of the Black and Azov Seas (further on the Program) in order to assess the consequences of the incident in the Kerch Strait.
The Program provided for the integrated marine monitoring investigations and assessment of the impact of the incident pollution in the Kerch Strait. The Program was coordinated by the Ukrainian Scientific Center of the Sea Ecology (UkrSCES - Odessa) and implemented jointly with the Institute of the Biology of the Southern Seas (IBSS-Sevastopol), Marine Hydrophysical Institute (MHI-Sevastopol), Ukrainian Scientific and Research Institute of the Environmental Problems (USRIEP-Kharkov), and the Southern Institute of Fisheries and Oceanography (YugNIRO-Kerch).
The Program also provisioned the possibility of participation of scientists from the Russian Federation in the implementation of the joint marine monitoring studies in the assessment of the consequences of the Kerch incident for the marine environment. This possibility was discussed at the meeting of the Joint Russian-Ukrainian Working Group on the liquidation of the consequences of the natural disaster that took place on 11-12 November 2007 in the Kerch Strait.
According to the Program two research expeditions were organized on board of the research vessel “Vladymyr Parshin” which allowed the comprehensive assessment of the state of the environment of the Kerch Strait and adjacent areas of the Black and Azov Seas. Based on the analysis of the collected data the significant impacts on the marine ecosystem were not observed. In the second expeditions the Russian representative (State Oceanographic Institute, Moscow) took part and collect the samples of bottom sediments from the Kerch Strait area.
6.4. The measures for the cleanup operation and utilization of the sand - heavy fuel oil mixtures
According to the Ukrainian assessments, 2000 tons of total 4077 tons of heavy fuel oil cargo carried by Volganeft-139 were spilled into the Kerch Strait causing the pollution of the marine and coastal environment of the Strait and adjacent areas in the Black and Azov Seas.
In the first phase of the cleanup operations 5940 tons of sand-heavy fuel oil mixture were collected: in 2007 - 4200 tons, in 2008 - 1740 tons, respectively. Somewhat later 400 tons of sand-heavy fuel oil mixture were collected in the coastal area of the Kherson administrative unit that were stored at specially organized storage places nearby v. Zalizny Port, Krugloozerkа and at the former plant for construction materials in the town of Genichensk and were utilized by the local authorities. More than 450 tons of the sand-heavy fuel oil mixtures were collected from the coastal area of the Tuzla Island.
The collected in the cleanup operation of the marine environment and coastal area sand-heavy fuel oil mixture was transported and stored at the territory of the State Enterprise «Kerch Marine Trade Port». The decision about the location of the technological equipment designed for the processing of the sand-heavy fuel oil mixture was made based on findings of the scientific and technological seminar on the selection of the technology for utilization of mixture held on 24.03.2008 in the city of Kerch. Finally the mixture processed into 6765,350 tons of commercial road paving materials by 04.12.2008 according to the report of the State Enterprise «Kerch Marine Trade Port».
6.5. Assessment of the economic losses from the environmental pollution of Ukraine resulted from the emergency situation
The Ministry of the Environmental Protection estimated the economic losses from the oil pollution of the environment resulted from the wracked vessels in the territorial sea and inner marine waters of Ukraine at a total amount of 1 064 824 292 USD calculated according to the size of fines for environmental pollution (approved by the Resolution of the Cabinet of Minister of Ukraine dated 03.07.1995 № 484).
Additionally the Republic Committee for the Environmental Protection of the Autonomous Republic of Crimea made the final estimations based on the measurements of the compositions and properties of soils at the 91 control sites (calculated with use of the Methodology of Calculation of Losses From Pollution and Littering of the Land Resources in Case of Violation of the Environmental Legislation (approved by the Order of the Ministry of the Environment dates 04.04.2007 № 149 are registered in the Ministry of Justice on 25.04.2007 № 422/13689).
Based on the analysis of the samples collected since November 2007 till April 2008 the total amount of losses from the pollution of land resources reached 432 798 366 UAH or 85 702 646 USD. Thus, total amount of economic losses from pollution of the environment of Ukraine is 1 150 526 938 USD.
According to the Order of Vise Prime Minister of Ukraine (04.2008 №18445/1/1-08) the Ministry of Justice of Ukraine was designated responsible for requesting the payments for the environmental losses resulted from the incident in the Kerch Straight and the full liability of the foreign judicial entities.
The Ministry of the Environmental Protection within its power and competence prepared a set of documents on the legal grounds and evidences in the court case of liability for caused environmental damage and submitted this set to the Cabinet of the Minister of Ukraine (letter dated 28.03.2008 № 4024/19/10-08) for further actions.
According to the Procedure of Implementation of the Protection of the Rights and Interests of Ukraine During the Settling the Conflicts, Trial in the International Judicial Bodies the Cases with Participation of the Foreign Subject and Ukraine (approved by the Decree of the President of Ukraine on 25.06.2002 № 581) the Inter-governmental Working Group on the Preparation of the Appeal of Ukraine on the Compensation of Losses was formed.
In November 2007 the Ministry of the Environmental Protection formed the Working Group for coordinated operational collection, analysis and assessment of the environmental data, cleanup actions and making the grounded decisions on elimination of the consequences of the incident that was transformed into the Governmental Commission for the assessment of the environmental damage resulted from the incidents of the marine vessels on the later stage as well as preparation of the proposals for the localization and liquidation of pollution, as well as future minimization of the effects and prevention measures. Two working meetings of the specialized working group and three meetings of the Governmental Commission were held.
The Governmental Commission on Elimination the Consequences of the Natural Disaster Occurred on 11-12 November 2007 in the Kerch Strait (further on the Governmental Commission) was formed according to the Resolution of the Cabinet of Ministers dated 19.03.2008 №496-р for coordination of the activities of the involved central and local executive authorities. The tasks of the Governmental Commission were the analysis of the urgent needs for the minimization of the negative impacts of the incidents and adoption of the adequate decisions aimed at the coordination of the actions of the central and local authorities in elimination these consequences
The Governmental Commission met three times - 21.03.2008, 03.04.2008 and 25.12.2008. At the first meeting held on 21 March 2008 the following issues were discussed and approved:
organization of the work of the Governmental Commission,
utilization of the collected sand-heavy oil fuel mixture that was stored at the territory of the State Enterprise «Kerch Marine Trade Port» and at the coast of the Arabatska Spit and safety of its storage,
Action plan of measures for elimination of the consequences of the Kerch Strait that has been developed in line with Order of the Cabinet of Ministers of Ukraine dated of 19.03.2008 № 496-р «About the urgent measures to overcome the consequences of the natural hazard that happened on 11-12 November 2007 in the Kerch Strait»,
Organization of the working visit of the members of the Governmental Commission to the Autonomous Republic of Crimea.
The approved resolutions of the Commission were as follows:
approval of the selection of the company for utilization of the sand–heavy oil mixture (Company «Ecocenter», city of Kirovograd),
approval of the tender procedure for one company (Company «Ecocenter»),
approval of the Action Pan for measures of the elimination of consequences of the Kerch Strait Incident on 11-12 November 2007.
As a follow up of the Meeting of the Governmental Commission the technical seminar on the selection of the technology for processing of the sand heavy oil fuel, at which the representatives of executive authorities of the Republic of Crimea and Crimean Academy of Sciences, city of Kerch were present, was held and following decisions were made and implemented:
The selection place for technological equipment for processing the sand-heavy oil fuel mixture at the State Enterprise «Kerch Marine Trade Port»,
Approval of the technology for processing the sand-heavy oil fuel mixture proposed by the Company “Ecocenter” and recommended by the Governmental Commission.
The Task Force for Elimination of the Consequences of the Kerch Incident started its work as was recommended by the technical seminar and the action plan for processing of the sand-oil mixture stored at the State Enterprise “Kerch Marine Trade Port” was approved and its implementation started.
The second Meeting of the Governmental Commission in which members of the Task Force for Elimination of the Consequences of the Kerch Incident, experts and representatives of the public participated also was carried out in Kerch in 2008. During the meeting the progress in the processing of sand-heavy oil fuel mixture was presented and the necessary measures for its completion were approved as well as further steps for improvement of cooperation with the Russian Federation in solving the environmental problems in the Black and Azov Seas were discussed.
The third meeting of the Governmental Commission was held on 25 December 2008 in the city of Kiev that reviewed the implemented activities and concluded that all tasks in elimination of the environmental pollution in the Kerch Strait were successfully realised. The Governmental Commission was dissolved by the Cabinet of Minister of Ukraine.
6.7. The Joint Ukrainian–Russian Working Group on the Elimination of Consequences of the Natural Disaster in the Kerch Strait on 11-12 November 2011
The bilateral Working Group of the Russian Federation and Ukraine was formed in the end of 2007. For the implementation of the Para 3 of the Resolution of the Cabinet of Ministers of Ukraine dated 19.03.2008 № 496-р «About Urgent Measures for Elimination of Consequences of the Natural Disaster that occurred on 11-12 November 2007 in the Kerch Strait» the work of the Joint Ukrainian-Russian Working Group on the Elimination of the Consequences of Natural Disaster Occurred on 11-12 November 2007 in the Kerch Strait (further on the Working Group) was renewed. Four Meetings of the Working Group were held: 22.05.2008, Anapa, 17.07.2008, Kerch, 07.11.2008, Anapa and 29.05.2008, Kerch. The Working Group approved:
a) Plan of Joint Actions of the Ukrainian and Russian Parties in Elimination of the Consequences of the Kerch Incident, safety of marine transport and environmental safety in the area,
b) Program of joint monitoring observations of the environmental state of the Kerch Strait proposed by the Ukrainian Party.
During the work of the Group the following issues were discussed:
· salvaging of the vessels «Volnogorsk», «Kovel» and «Nakhichevan» that sank in the Kerch incident on 11-12 November 2007,
· joint marine monitoring investigations for the assessment of the state of the marine environment in the area of the Kerch Strait and adjacent areas of the Black and Azov Seas,
· introduction of the regional system of safety of marine transport and environmental safety in the Black and Azov Seas,
· joint action plan for elimination of the incidents and ensuring the safety of marine transport and environmental safety,
· improvement of coordination of the corresponding competent authorities of Ukraine in the ensuring the safety of marine transport and environmental safety in the Black and Azov Seas.
The most important outcome of the discussions in the framework of the Working Group was the achieved agreement above salvaging and transportation of the damaged sunken parts of the tanker Volgoneft-139 the most dangerous for the marine environment along the Russian coast.
The coordinated actions of the competent national authorities of Ukraine and the concerned central and local authorities and public for elimination of the consequences of the incident that occurred on 11-12 November 2007 in the Kerch Strait were evaluated as timely and efficient in implementing the tasks established by the Government of Ukraine and the President of Ukraine.
The implementation of the Action Pan for measures of the elimination of consequences of the Kerch Strait Incident on 11-12 November 2007 did not require additional resolutions, therefore the Cabinet of Minister dissolved the Governmental Commission and the competent authorities pursued the following:
· Salvaging of the ships Volnogorsk, Nakhichevan and Kovel,
· Further strengthening of the state system of safety of marine transport and environmental safety,
· seek compensation of economic losses resulting from the pollution of the marine and coastal environment of Ukraine that shall be coordinated by the Ministry of Justice and the Ministry of Transport,
· strengthening the Russian–Ukrainian cooperation in safety of marine transport and environmental protection.
[1] The Commission on the Protection of the Black Sea Against Pollution (Black Sea Commission, BSC, www.blacksea-commission.org) is the intergovernmental body established in implementation of the Convention on the Protection of the Black Sea Against Pollution (Bucharest Convention) which was signed in 1992 and later ratified by all Black Sea countries. The basic objective of the Bucharest Convention is to substantiate the general obligation of the Contracting Parties to prevent, reduce and control the pollution in the Black Sea in order to protect and preserve the marine environment and to provide policy and legal frameworks for co-operation and concerted actions to fulfill this obligation. The BSC works in the field of environment safety aspects of shipping under a special Protocol (PROTOCOL ON COOPERATION IN COMBATING POLLUTION OF THE BLACK SEA MARINE ENVIRONMENT BY OIL AND OTHER HARMFUL SUBSTANCES IN EMERGENCY SITUATIONS, http://www.blacksea-commission.org/_convention-protocols.asp#Emergency), Strategic Action Plan for the Environmental Protection and Rehabilitation of the Black Sea (adopted by the Black Sea coastal states in April 2009, http://www.blacksea-commission.org/Official Documents/Black Sea Strategic Action Plan 2009/ ) and Regional Contingency Plan (http://www.blacksea-commission.org/_table-legal-docs.asp), which substantiates the procedures and obligations of contracting parties during emergency situations.
[2] The strategic importance of the Black Sea region as a production and transmission area for diversification and security of energy supply for the EU is mentioned in an EU parliament resolution of 17th of January 2008, http://eur-lex.europa.eu/LexUriServ/LexUriServ.do?uri=OJ:C:2009:041:0064:01:EN:HTML (EU-2008, 2008). The latter calls on the Council and the Commission to urgently consider increasing their practical support for infrastructure projects of strategic importance; reiterates its support for the creation of new infrastructure and viable transport corridors diversifying both suppliers and routes, such as the trans-Caspian/trans-Black Sea energy corridor and the Nabucco, Constanța-Trieste and AMBO pipelines, as well as other planned gas and oil transit projects crossing the Black Sea and the Inogate (Interstate Oil and Gas Transport to Europe) and Traceca (Transport Corridor Europe — Caucasus — Asia) projects connecting the Black Sea and Caspian Sea regions; calls for social and environmental impact assessments to analyse the impact of the construction of such new transit infrastructures. The EU parliament resolution of 13th of December 2007 directly refers to the Kerch accident and calls on the Council and the European Commission to monitor closely the situation.
[3] The Balaklava storm (November 1854) is quoted as one of the most disastrous storms that ever happened in the Black Sea. For more details see Chapter 3 of the book.
[4] Note: At the Russian Port Caucasus on the Strait of Kerch, the Taman Handling Complex - a new floating oil-chemical port - was built to handle the petroleum products, sulfur and fertilizers transshipments from small to bigger boats. The small boats were ‘river-sea’ type, and could not withstand a high-waves sea. Therefore those boats were not supposed to enter the sea. With its shallow water, high winds, lack of natural shelter for the boats and the rapid formation of water spouts possibilities, the Kerch Strait was an unsafe place where accidents were likely to happen. In addition, most of the boats were old, for instance the Volgoneft-139 tanker was built in 1978, Nahichevan - in 1966, Volnogorsk - in 1965, and Kovel - in 1957.
[5] Transshipment areas (Fig. 2) are located in the in shallow waters of the Kerch Strait Southern part without a natural shelter from storms. When ships lie at anchor in the Southern area of the Kerch Strait, as well as at the berth with the coordinates 45°06’N, 36°33’E, they are positioned about 15 miles away from the place of refuge (the Northern area of the Kerch Strait which is well protected from the Southern waves by the Tuzla Island and Chushka Spit, being considered as the place of refuge). The berths in the Southern area of the Kerch Strait do not provide protection from the waves coming from the hazardous Southern directions especially.
[6] Three dry cargo ships sank in the Kerch Strait - Volnogorsk, Nahichevan, Kovel (Russian flag); the Hach Ismail sea-going dry cargo ship (Georgian flag, Syrian crew) sunk near Sevastopol and 15 persons went missing. Six vessels stranded – the Vera Voloshina dry cargo ship (Ukrainian flag) – near the Sudak village off the Meganom Cape in Crimea, after stranding, the ship’s hull broke in two, but the crew did not suffer; the Ziya Koc sea-going dry cargo ship (Turkish flag , Turkish crew) and Captain Ismael (Georgian flag , Syrian crew) – in Novorossiysk, the Dika and Dimetra barge vessels (Russian flag) – in the Kerch Strait, the Sevastopolets-2 ship crane (Russian flag) – South-East of the Kerch Strait; two ships were damaged (the BT-3754 barge and the Volgoneft-123 tanker ship with a crack in her hull (Russian flag ) – in the Kerch Strait. The Volgoneft-139 tanker (Russian flag) ship-wrecking in the Kerch Strait is described in more detail in Chapter 4.5
[7] Later, Mr. Valentin Pilipenko, the ex-Captain of the Port of Kerch listed the reasons for the Kerch accident as follow: lack of preperadness of the ‘river-sea’ boats captains to sail in marine areas, especially at the high-waves sea; lack of experience in using the life-saving equipment; poor communication (none of the vessels in distress could give a signal SOS prescribed by the international documents, attempts to use life rafts and evacuate the sailors were unsuccessful, two of the boats were lost of contact, i.e., Volnogorsk and Nahichevan, and information about their fate came from nearby vessels. And the last but not least: in pursuit of profi,t the vessels owners often restricted their captains to act in accordance with legal documents violating by this the established rules.
[8] One drop of oil on the water surface creates a spot with of a 0.25 square meters area; the relevant figure for one ton of spilled oil is about five square kilometers.
[9] Note: The Russian Federation and Ukraine have not adopted officially the Black Sea Regional Contingency Plan, though the Plan was recognized as fully operational during a number of Black Sea regional exercises aimed to enhance the oil spill preparedness and response of the Black Sea coastal states (DELTA Exercises – SULH 2007, RODELTA 2009, see BSC Newsletters N 10 - and N 12 - ). Russian Federation plans to adopt the RCP in 2011. Ukraine is not yet ready.
[10] It has been the Marine Branch of Ukrainian Hydrometeorological Institute (Kiev) since 1992.
7 Head of Hydrological Problems Laboratory of Sevastopol Branch of SOI.
[11] There is a practice in Russia and Ukraine: oil and oil products are being transported down the rivers by the river-sea class vessels to the sea ports and then re-loaded to the sea-type tankers. Vessels do not enter the shallow river ports or do not do this due to economical reasons. The river-sea class vessels can not withstand powerful storms as was demonstrated by the tragedy in the Kerch Strait.
[12] There were no measurements of trace metals in water
[13] The Ministry for Civil Defenses, Emergencies and Elimination of Consequences of Disasters (EMERCOM of Russian Federation).
[14] Annex4 of the RCP: Directory of response personnel and inventory of response equipment, products to be offered as assistance of activation of the Regional Plan for Co-operation.
[15] One drop of oil on the water surface creates a spot with an area of 0.25 square meters; the relevant figure for one ton of spilled oil is about five square kilometers.