This section of the report includes:
· scientific data on ML which are definitely scarce, and
· expert evaluation of some basic characteristics of ML pollution provided by the national consultants on base of their personal experience and understanding of the situation in their countries.
As it follows from the national reports, there were no
any ML research, monitoring or assessment activities in
No special study of ML effects (including environmental
impact, public health influences, economic consequences, etc.) has been carried
out in the
5.1.1. Data on marine litter in the marine environment
A. The first attempt to estimate approximate
level of ML pollution in the
A series of aerial surveys have been carried out during
seven days within the period from 2-17 August
Just after passing any trackline the observers recorded
their cumulative appraisal of ML pollution along the trackline as follows: “
| VML = | s1L1 + s2L2 + … + snLn | ·
|
| n (L1 + L2 + … + Ln) |
s – average ML score estimated for each trackline surveyed,
L – length of each trackline surveyed (km),
n – number of surveyed tracklines.
|
|
Fig. 5.1. Study areas surveyed in August 2002. Tracklines used for ML surveying are shown as solid lines of different thickness. The thickness of lines corresponds with average ML scores estimated for each trackline: from 0 (the most thin line) to 1,7 (the most thick line).
Moderate number of plastic ML items was detected in the
Fig. 5.2. ‘Chernov-
Table 5.1. Estimated relative values of ML pollution (aerial survey, August 2002)
| Study areas | Observation effort, L (km) | Limits of average ML scores, s | Estimated value of ML pollution (VML) |
| |
351 | 0.5 – 1 | 12 |
| |
190 | 0 – 1.7 | 10 |
| |
615 | 0 – 1.7 | 5 |
B. Quite different aerial ML surveys have been
conducted in the Russian Black and
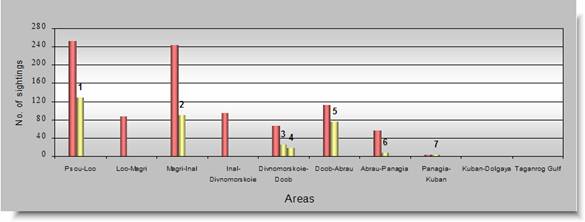
A total of 918 sightings of floating ML were recorded in
2004, and 949 sightings – in 2005. Typical quantitative distribution of ML
sightings between different areas and study plots is shown on the diagram (Fig.
5.3). According to the data presented, the maximum number of ML sightings
occurred in the southern part of the Russian Black Sea near
Thus, it could be tentatively assumed that the eastern
![]()
![]() Research areas in total
Research areas in total ![]()
![]() Study plots/strata within the
research areas:
Study plots/strata within the
research areas:
| 1 Port of
|
5 Tsemesskaya bay |
| 2 Port of Tuapse | 6 Port of Anapa |
| 3 Gelendzhikskaya bay | 7
|
| 4
|
Fig. 5.3. Number of ML sightings recorded in
The results of those aerial surveys suggested that major
quantity of ML comes to the Russian Black Sea in late spring and early summer
(in May and June), while the least of ML sightings was recorded in autumn (in
September and October). It was supposed that the level of ML pollution depends
mainly on the level of river run-off in this area. Snowmelt floods and
torrential downpours are typical for Russian Caucasus on the verge of spring
and summer, and numerous mountain rivers become swollen during this season. It
seems very likely that just river and rain torrents along with the washed down
land-based garbage and solid waste constitute crucial sources/suppliers of ML
pollution in the internal and territorial waters of
Fig. 5.4. Potential ML on the river bank,
Russian
(photo by Y. Yurenko)
In the internal Russian waters ML usually was sighted in
narrow zone along the coastline, mainly in bays and harbours, with particular
trend to accumulation in semi-closed inshore areas, such as
C. The vessel-based line transect surveys have been carried out in 2003 for the
purpose to estimate cetacean abundance and numerical values of ML pollution in
the Ukrainian part of the Kerch Strait (345 km2;
Fig. 5.5. Study area and 13 parallel
tracklines used for the vessel-based line transect survey in Ukrainian waters
of the
Fig. 5.6. Study area and 57 zigzag
tracklines used for the vessel-based line transect survey in Ukrainian
territorial waters of the
The surveys were conducted under the sea state score
from 0 to 3 according to Beaufort scale, by means of two observation platforms
(a longboat in the strait and cruising yacht in the sea) sailed at a speed of
6–9.4 knots. Changeable pairs of observers, rotated every 30–60 minutes,
continuously scanned water surface from both sides of a vessel with the naked
eye; a height of observers eyes above sea level varied from 2.6 to
A total of 479 sightings (591 pieces) of floating
plastic ML have been recorded in the Ukrainian Black Sea between the Danube
Delta and
The minimum values (uncorrected for detection bias) of
ML pollution with drifting plastics were estimated for territorial waters of
· general density of floating plastic objects – 6.57 pieces/km2 (CV 18%);
· absolute amount of floating plastic objects – 158,620 pieces (CV 18%).
It was supposed that average mass of one plastic object
being either in the sea or on the beach (see Section 5.1.2, A) is equiponderant
making up
Fig. 5.7. Estimated number of ML items per
The primary data on ML composition were obtained but not
analysed and published yet. However, it was calculated that a share of plastic
bottles constituted 5.25% in overall number of ML sightings recorded in the
Black Sea area (Fig. 5.8), and their estimated density came to 0.18 bottles/km2 (CV 28%), whereas in the Kerch Strait this factor mounted tenfold to 1.84
bottles/km2 (CV 45%). Thereupon, it was assumed that the
general density of floating plastic ML was also in 10 times higher in the
strait than in the sea. Taking into consideration this assumption, the expected
general density, absolute amount and aggregate mass of floating plastics were
estimated for Ukrainian waters of the
Fig. 5.8. Estimated number of plastic
bottles per
D. Similar cetacean and ML vessel-based surveys
have been carried out by the same joint Ukrainian and Russian team (“Afalina-
E. In 2005, the Underwater Cleaning and Awareness
Activity (STH, environmental NGO registered in
The method used by underwater cleanup team was random sampling. A total of 1606 ML pieces under 224 different titles were recorded. After each survey the STH prepared a file including all data obtained (in the form of inventory list), underwater photo and video images, expert judgment concerning suspected sources of ML pollution, and practical recommendations. The inventory lists (see example in Annex 5) lay the groundwork of a database on the sunken ML recorded in various locations.
The composition of ML items sighted by divers within the water column and on the bottom of study areas is presented on Fig. 5.9. Most pieces on record (77%) were produced from glass, plastic and metal.
| Plastic | Glass | Metal | Wooden | Porcelain | Textile | Hybrid* | Paper | Other | Total |
| 403 | 508 | 327 | 24 | 34 | 40 | 218 | 24 | 28 | 1606 |
* Hybrid: objects formed from more than one material
Fig. 5.9. Composition of ML items recorded
in the
A tendency to ML accumulation on the bottom has been
ascertained in some places (e.g., in Ortaköy at a depth of 8-
5.1.2. Data on marine litter in the coastal environment
A. Some research of ML in the coastal environment
was conducted in
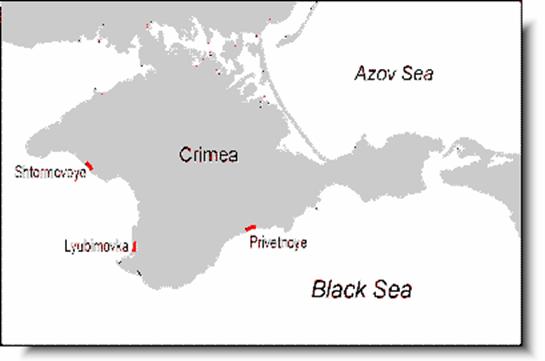
Fig. 5.10. Location of study areas (examined
plots of the beach) in the
Great numerical predominance of plastic ML (80–98% of the recorded pieces) has been determined in different coastal areas and seasons in comparison with glass ML (2–20%) represented mainly by broken and unbroken bottles. The density of pollution by polymeric garbage (including scraps of polyethylene film, plastic bags and bottles, other synthetic ware, etc.) varied on the beaches from 2,698 to 55,000 pieces/km2, while the density of glass bottles ashore fluctuated between 280 and 1,455 pieces/km2.
The ML weighting indices varied from 333 to 6,250 kg/km2 (plastics) and from 222 to 1,455 kg/km2 (glass). The
average mass of one plastic object contaminating the coastal strip came up to
The average overall values of ML quantity on the Crimean unorganized beaches were estimated as follows (M ± m):
· density of plastic objects – 16,348 ± 5,076 pieces/km2;
· mass of plastics objects – 1,910 ± 612 kg/km2;
· density of glass objects (bottles only) – 674 ± 107 pieces/km2;
· • mass of glass objects (including bottles) – 552 ± 96 kg/km2.
A few examples of ML accumulation on the Crimean beaches are shown on Fig. 5.11.
On 10 May 2003, huge quantity of petroleum tar balls
(very specific ML item indeed) were found washed ashore along 30-km-long
sandy beach between Cape Evpatoriyskiy and Lake Donuzlav, western Crimea. The
clots were collected and weighted from the area of
B. Numerous
“spontaneous heaps” of ML have been sighted during aerial surveys conducted by
CHEMBAS in 2003, 2004 and 2005 (see Section 5.1.1, B) along unpopulated (but
visited by unorganized tourists) portions of the Russian Black Sea and
C. Important data on permanent sources of ML have
been published recently by Turkish specialists (Çelik,
2002; Yıldırım et al., 2004; Berkun et al., 2005).
Solid waste management is one of the main environmental problems in the Black
Sea Region. (Çelik, 2002). It was acknowledged that at the
Environmentally dangerous mode of solid wastes disposal
is still realized, in particular, via irregular and uncontrolled landfill sites
situated in the immediate proximity to the sea, by some
In this context, Yıldırım et al.
(2004) presented a case study regarding the municipal solid waste landfill site
near Zonguldak city, the
southwestern
For years there was no wall or any other constructions providing stability for the rubbish heap and preventing rubbish mass transportation into the sea. As a result, the deposited wastes were subjected to waves, and supposedly huge (but really undefined) amount of potential ML items was transported annually into the sea as well as scattered along the coastline. (Yıldırım et al., 2004).
The landfill used causes also other problems including the spreading out of plastics and paper by wind, odours, creating a habitat for insects and rodents, groundwater pollution and producing landfill gases, as the case for similar landfill areas in other parts of the world (Gonullu, 1999, Mavropoulos and Kaliampakos, 1999).
Fig. 5.11. Accumulation of wooden and
plastic ML on
(two left photos) and June 2003 (right photo), photo by A. Birkun, Jr. )
The composition of Zonguldak solid wastes was determined as follows (a total of
· organic waste 30.7 %
· paper and carton 20.0 %
· plastic 16.1 %
· ash 10.9 %
· glass 6.1 %
· medical (hospital and clinic) waste 6.0 %
· metal 3.8 %
· miscellaneous (tire, wood, bone, leather) 3.8 %
· textile 2.6 %
Fig. 5.12. The beached paper sack with tar
balls melting on the heated sand in the vicinity of Shtormovoye (western
photo by A. Birkun, Jr.
|
|
|
|
|
|
|
|
|
Fig. 5.13. Main towns discharging solid
wastes at the
(after Yıldırım et al., 2004; Berkun et al., 2005).
It was concluded that the landfill in Zonguldak province
may cause potential threats throughout the

Fig. 5.14 Enormous deposit of ML represented by the landfill near Zonguldak.
Human figures on the coast suggest that
a height of the waste dump is not less than
In the countries around the
Besides, according to available data (Table 5.2) the problem of solid wastes is presently seriously taken under the control of the Turkish Ministry of Environment and Forestry.
| Solid waste disposed | ||||||||||||||||||||
| Provinces | Total disposal | Metropolitan municipality dumping site | Municipality dumping site | Another municipality's dumping site | Controlled landfill | Composting plant | Burning in an open area | River and lake disposal | Burial | (1) Other (1) | ||||||||||
| A | B | A | B | A | B | A | B | A | B | A | B | A | B | A | B | A | B | A | B | |
| Artvin | 12 | 35 548 | - | - | 10 | 28 900 | - | - | - | - | - | - | 1 | 579 | - | - | 1 | 1 677 | 1 | 4 392 |
| Giresun | 25 | 87 886 | - | - | 11 | 66 393 | 6 | 9 786 | - | - | - | - | 3 | 1 159 | - | - | 1 | 165 | 4 | 10 383 |
| İstanbul | 73 | 4 470 687 | - | - | 17 | 148 123 | 1 | 732 | 56 | 4 156 395 | 1 | 151 158 | 2 | 1 926 | - | - | - | - | 3 | 12 353 |
| Kastamonu | 21 | 125 881 | - | - | 17 | 117 384 | - | - | - | - | - | - | 1 | 5 612 | 2 | 688 | 1 | 2 196 | - | - |
| Kırklareli | 26 | 123 392 | - | - | 25 | 122 870 | - | - | - | - | - | - | - | - | - | - | - | - | 1 | 522 |
| Kocaeli | 45 | 380 446 | - | - | 11 | 140 422 | 3 | 36 435 | 30 | 200 898 | - | - | - | - | - | - | - | - | 4 | 2 692 |
| Ordu | 56 | 158 060 | - | - | 39 | 150 099 | 6 | 5 152 | - | - | - | - | 2 | 586 | 3 | 568 | 3 | 988 | 3 | 667 |
| Rize | 21 | 89 083 | - | - | 8 | 67 792 | 7 | 3 376 | - | - | - | - | - | - | - | - | 4 | 6 740 | 2 | 11 174 |
| |
47 | 301 037 | 15 | 148 725 | 17 | 136 267 | 7 | 4 825 | - | - | - | - | - | - | 2 | 794 | 4 | 9 759 | 2 | 667 |
| Sinop | 11 | 64 979 | - | - | 7 | 20 076 | - | - | - | - | - | - | - | - | - | - | 3 | 44 876 | 1 | 26 |
| |
64 | 168 767 | - | - | 16 | 115 463 | 30 | 22 763 | - | - | - | - | 2 | 302 | 2 | 1 419 | 8 | 11 940 | 7 | 16 881 |
| Zonguldak | 32 | 322 460 | - | - | 26 | 291 453 | 6 | 31 007 | - | - | - | - | - | - | - | - | - | - | - | - |
| Bartın | 9 | 37 183 | - | - | 8 | 33 949 | 1 | 3 234 | - | - | - | - | - | - | - | - | - | - | - | - |
| Karabük | 8 | 58 544 | - | - | 8 | 58 544 | - | - | - | - | - | - | - | - | - | - | - | - | - | - |
Number of municipalities (Metropolitan municipality means population larger than 750 000; Municipality – population larger than 5000).
Amount of solid waste (tonnes/year) D. Since
2002, the Turkish Marine Environment Protection Association (TURMEPA,
According to available statistics, a total of 2009
individuals collected
As it follows from this estimation, the shoreline and recreational activities along with smoking-related activities constitute the two major sources of ML contamination of the coast. These activities taken together, allegedly, caused 95.5-96.8% of ML pieces found on the seashore, while the dumping activities were considered responsible for 0.8-1.1% of ML objects only. (Comments from the Regional consultant: Such ratio seems to be very questionable (strongly biased) with its particular reference to the Turkish Black Sea territories because of numerous solid waste dumping sites situated there in direct contact with coastal and marine environment (see Section 5.1.2, C). It seems more likely that at least some or, perhaps, most floating ML items (such as plastic bags, bottles and crockery) were trasported by sea currents and winds from the uncontrolled landfills to the localities where they were recorded).
E. In 2001, two environmental NGOs - the Greener Bourgas Foundation (GBF; Bourgas, Bulgaria) and Mare Nostrum (Constantsa, Romania) implemented a project entitled as the “Clean Beaches – first commitment for sustainable tourism development” (supported by the Regional Environmental Center for Central and Eastern Europe). The common methodology has been elaborated for ML coastal surveying, and practical guidelines were prepared in the form of a handbook for the assessment of ML pollution on the seashore (Beach Survey Strategy, 2001).
The Bulgarian team monitored five popular beaches in Bourgas, Pomorie and Sozopol during March–July 2001. The volunteers collected, classified and recorded various ML items and prepared a detailed report which is enclosed as Annex 6.
Besides, during the period from 15 June to 15 July, more than 1,500 visitors of the Bulgarian beaches were interviewed on base of preliminary elaborated questionnaire. As a rule, the holiday-makers appreciated climatic conditions of the beaches but most of them (more than 60 or even 90% of the visitors) answered that they do not like rubbish on the beach. The opinion of the beach visitors was that ML strongly (or very strongly) affects quality of the beach.
The recorded numbers of ML items are categorized in compliance with human activities – presumable sources of ML on the seashore (TURMEPA, pers. comm. to E. Okus).
National bibliographies on ML in the
Fig. 5.15. Composition of ML collected in
National ML consultants were requested to provide expert evaluation (make their own appraisal) regarding the state of ML pollution in their countries. With that end in view, they responded to four questions:
(a) How do you assess levels of ML pollution last year (in 2005)?
(b) How do you assess general trend of ML pollution during last decade?
(c) Can you specify five primary sources of ML and five all-important hot spots?
(d) Can you specify five principle items (constituents) composing ML?
The answers on these questions are summarized in Tables 5.3–5.9 presented below.
Table 5.3. Experts’ views on the level of ML
pollution in
| Country | Low | Moderate | Sustainable | High | Very high |
| |
yes | ||||
| |
yes | ||||
| |
yes | ||||
| |
yes | ||||
| |
yes | ||||
| |
yes |
Comment: The medium scores (“Moderate” or “Sustainable”) conferred by all national consultants, possibly reflect general uncertainty (a lack of solid scientific data) about actual levels of ML contamination in the marine environment.
Table 5.4. Experts’ views on the level of ML
pollution in
| Country | Low | Moderate | Sustainable | High | Very high |
| |
yes | ||||
| |
yes | ||||
| |
yes | ||||
| |
yes | ||||
| |
yes | ||||
| |
yes |
Comment:
As it was noted above, there was no ML
research activity in
Table 5.5. Experts’ evaluation of the general trend of ML pollution during last 10 years (1996-2005) in the marine environment
| Country | Decrease | Growth | No significant variation | No comment |
| |
yes | |||
| |
yes | |||
| |
yes | |||
| |
yes | |||
| |
yes | |||
| |
Yes |
Comment: The continuing accumulation of solid wastes on the uncontrolled landfills may cause a growth of ML in the marine environment due to spontaneous release of the wastes from the dumps into the sea by erosive factors such as waves, rain and wind. At the same time, the sea currents and wind play a role as ML dissemination factors contributing to the transboundary transport of floating wastes.
Table 5.6. Experts’ evaluation of the general trend of ML pollution during last 10 years (1996-2005) in the coastal environment
| Country | Decrease | Growth | No significant variation | No comment |
| |
yes | |||
| |
yes | |||
| |
yes | |||
| |
yes | |||
| |
yes | |||
| |
yes |
Comment: Turkish National Consultant indicates that the data published previously by some Turkish specialists (Yıldırım et al., 2004; Berkun et al., 2005) is quite outdated because in the recent years Turkey undertook a number of very active political steps and investment projects for combating pollution from solid waste disposal and improvement of waste management (see 4.2, pages 45-48).
Table 5.7. Primary sources of ML ranked according to the experts’ scores
| Source | |
|
|
|
|
|
Total |
| Municipal garbage/sewages (household waste) | 5 | 5 | 5 | 5 | 3 | 4 | 27 |
| Marine transport and ports (shipping waste) | 4 | 3 | 2 | 3 | 5 | 5 | 22 |
| Recreation activities in coastal area (litter produced by local population and tourists) | 3 | 4 | 3 | 4 | 1 | 3 | 18 |
| River run-off | 1 | – | – | 5 | 5 | – | 11 |
| Industry (incl. shipyard works) | 1 | – | 1 | – | 4 | – | 6 |
| Fishery (incl. abandoned nets) | 1 | 1 | 4 | – | – | – | 6 |
| Coastal construction (incl. house-building) | 2 | 2 | – | 2 | – | – | 6 |
| Agriculture | – | – | – | – | 2 | – | 2 |
| Transboundary transfer of floating ML | – | – | – | 1 | – | – | 1 |
Comment:
River run-off and transboundary transfer of floating ML by sea currents were
mentioned by some national consultants as the primary sources of ML pollution,
although they are not parental (initial) sources, but means of ML
transportation mainly. Anyway, ML transfer by sea currents seems to be not less
important in the
Table 5.8. ML hot spots indicated by the national consultants
| Country | ML hot spots (ranked in order of their importance) |
| |
1. Coastal cities (including seaside resort complexes)2. Ports3. Navigation routes4. Industrial zones along the beaches of Bourgas and
|
| |
1.
|
| |
1. Coastal cities2. Fishing areas3. Recreation areas4. Navigation routes5. Shipyards in Constantsa and Mangalia |
| |
1. River valleys and mouths**2. Beaches3. Ports and anchorage areas***4. Nearshore bottom of urbanized areas****5. Coastal waters between
|
| |
1. Yeşilırmak delta and basin2.
|
| |
1. Coastal cities (
|
* Hot spots added by the regional ML consultant in line with his own experience.
** Russian coast of the
*** In particular, harbours of
**** In particular, there are some sunk vessels and
abandoned gear within the shelf area between
Table 5.9. Basic groups of ML ingredients ranked according to the experts’ scores
| Type of ML items | |
|
|
|
|
|
In total |
| Plastic wares (bottles, bags, etc.) | 5 | 5 | 5 | 5 | 5 | 5 | 30 |
| Paper and carton (including various package staff and cigarette stumps) | 4 | – | 4 | – | 4 | 4 | 16 |
| Foodwastes | 2 | – | – | – | 5 | 2 | 9 |
| Metal objects (tins and cans, scrap metal) | 3 | – | – | 4 | – | – | 7 |
| Rubber goods (including old tires) | 1 | 2 | – | 3 | – | – | 6 |
| Textile rags | 1 | – | 3 | 1 | – | – | 5 |
| Wooden objects | 1 | 4 | – | – | – | – | 5 |
| Glass (bottles, etc.) | 1 | – | – | – | – | 3 | 4 |
| Medical wastes | 1 | – | – | – | 3 | – | 4 |
| Leather (old shoes, etc.) | – | 3 | – | – | – | – | 3 |
| Abandoned fishing and sailing gear | – | 1 | – | 2 | – | – | 3 |
| Hazardous wastes | – | – | – | – | 2 | – | 2 |